Arduino Nano 33 IoT - Serial Plotter
This guide shows you how to use the Serial Plotter in the Arduino IDE with an Arduino Nano 33 IoT board.
Hardware Preparation
Or you can buy the following kits:
| 1 | × | DIYables Sensor Kit (18 sensors/displays) |
Additionally, some of these links are for products from our own brand, DIYables .
Overview of Serial Plotter
The Serial Plotter is a tool in the Arduino IDE that can get data from the Arduino Nano 33 IoT using a serial connection and display it on a graph. It can show information from several sensors on one screen.
To get data from the Arduino Nano 33 IoT, connect it to your computer using a USB cable.
Serial Plotter has two parts:
- A selection box: This is used to choose the serial transfer speed.
- A graph: This is a screen that displays data visually.
◦ X-axis: Shows time with 500 points. The space between each point matches the time difference between two consecutive Serial.println() function calls.
◦ Y-axis: Shows the data values sent by the Arduino Nano 33 IoT. It automatically adjusts when the values go up or down.
How To Open Serial Plotter
In Arduino IDE, click on Tools and then choose Serial Plotter.
How to plot a Single Line on Graph
To draw one line on the graph, simply send your data ending with the \r\n characters. You can use the Serial.println() function.
※ NOTE THAT:
Serial.println() automatically adds a carriage return and a new line to the data.
Example Code
This sample Arduino Nano 33 IoT code reads a number from an analog input pin and sends it to the Serial Plotter.
Detailed Instructions
If you are new to the Arduino Nano 33 IoT, be sure to check out our Getting Started with Arduino Nano 33 IoT tutorial. Then, follow these steps:
- Connect the components to the Arduino Nano 33 IoT board as depicted in the diagram.
- Use a USB cable to connect the Arduino Nano 33 IoT board to your computer.
- Launch the Arduino IDE on your computer.
- Select the Arduino Nano 33 IoT board and choose its corresponding COM port.
- Copy the code shown above and paste it into the Arduino IDE.
- Click the Upload button in the Arduino IDE to compile and send the code to the Arduino Nano 33 IoT board.
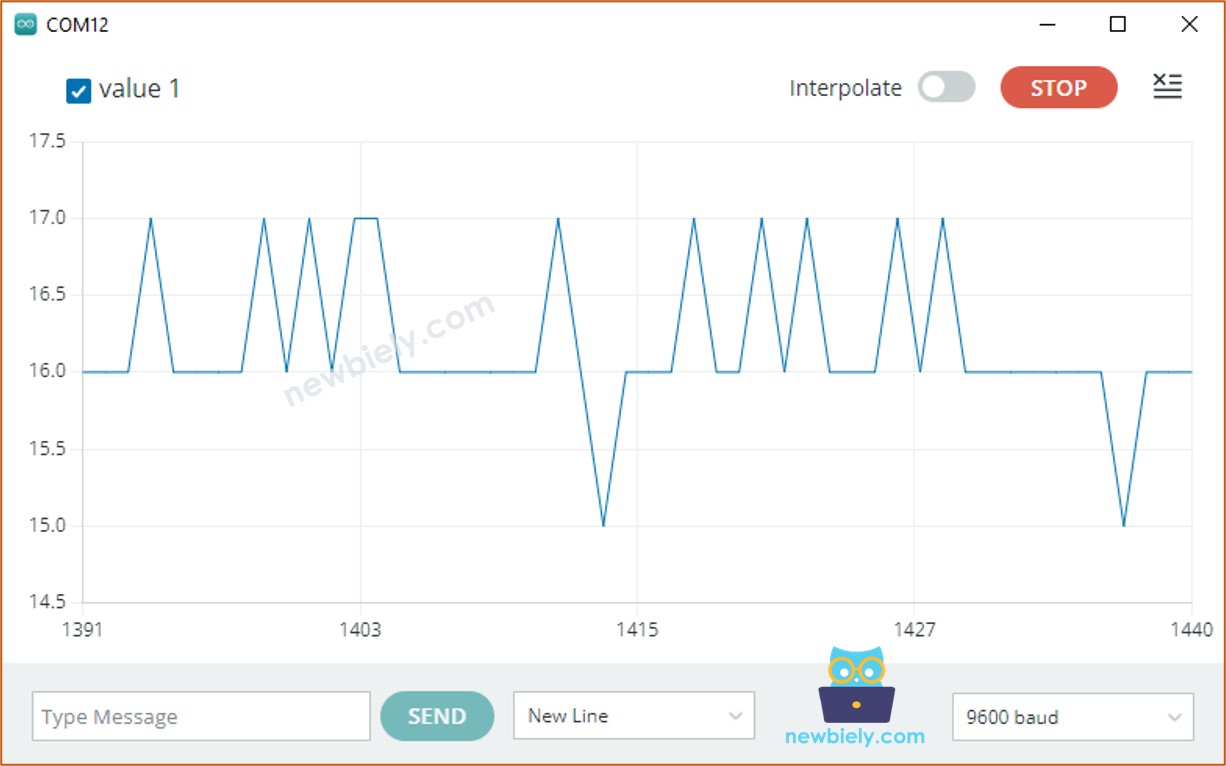
- Open the Serial Plotter.
- Choose 9600 as the baud rate.
- Look at the graph in the Serial Plotter.
How to plot multiple lines on Graph
To draw a graph with many numbers, separate each number using a tab ( ) or a space. The last number should end with a new line (carriage return and line feed).
A Simple Explanation:
- This is the first variable.
- The variables in the middle
- The final variable
Example Code
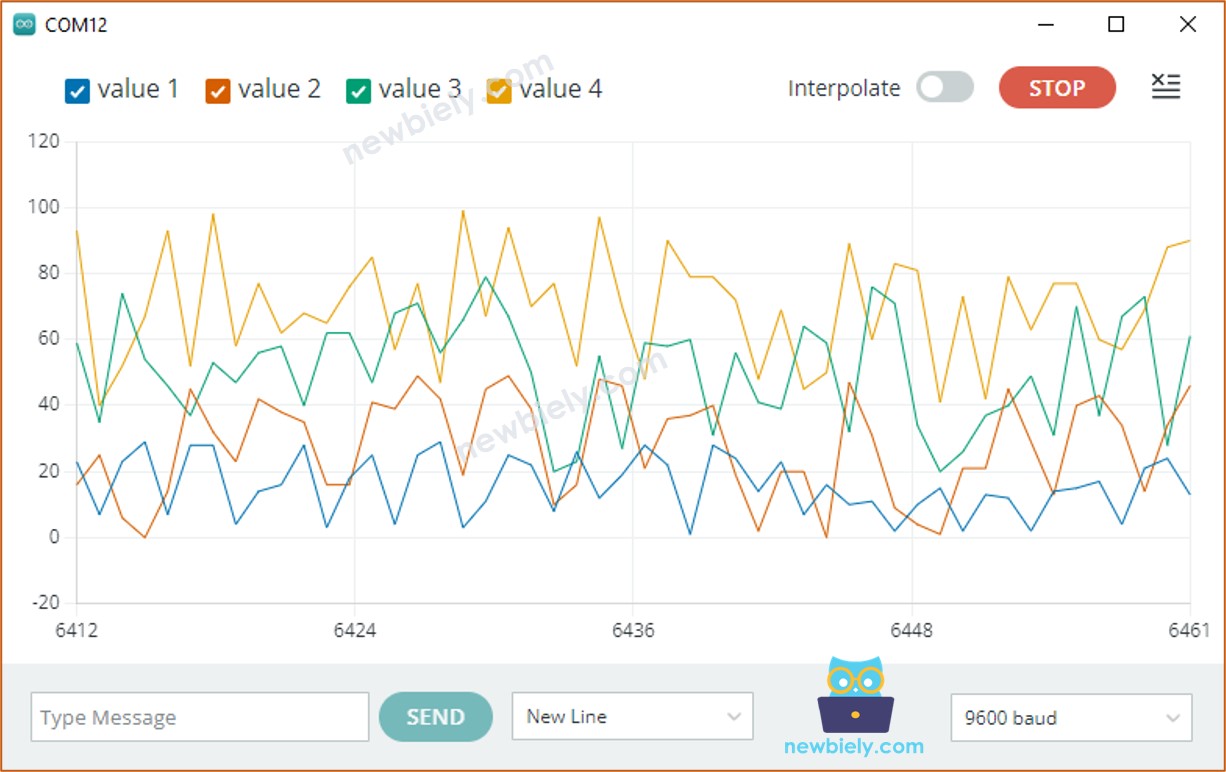
Below is an example code for the Arduino Nano 33 IoT. It reads data from 4 analog input pins and sends it to the Serial Plotter.
This is what shows up on the Serial Monitor:
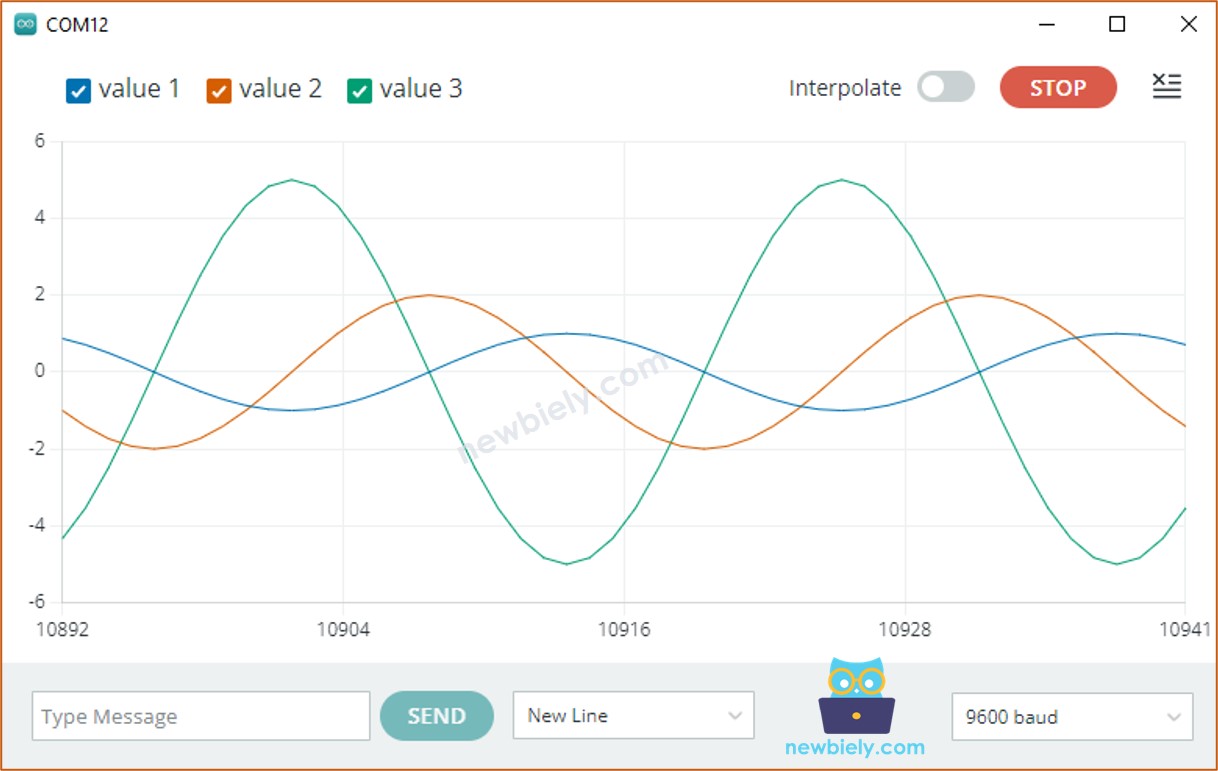
Example of 3 Sine Waveforms
The sample Arduino Nano 33 IoT code below shows three sine wave values on the Serial Plotter.
Here is what appears on the Serial Plotter:
If you want to see this plotter on your smartphone or computer, please check the Arduino Nano 33 IoT - Web Plotter tutotial.