Arduino Nano 33 IoT - TCS3200D/TCS230 Color Sensor
This tutorial shows you how to connect the TCS3200D/TCS230 color sensor to an Arduino Nano 33 IoT for accurate color detection and RGB measurement.
In this lesson, we will cover:
- Connecting the TCS3200D/TCS230 sensor to Arduino Nano 33 IoT
- Calibrating the sensor for precise color measurements
- Programming Arduino Nano 33 IoT to read and display RGB values
Hardware Preparation
Or you can buy the following kits:
| 1 | × | DIYables Sensor Kit (18 sensors/displays) |
Additionally, some of these links are for products from our own brand, DIYables .
Overview of TCS3200D/TCS230 Color Sensor
The TCS3200D/TCS230 sensor uses an 8×8 photodiode array for detecting colors through optical filters. This 64-photodiode grid includes 16 with red filters, 16 with green filters, 16 with blue filters, and 16 without filters (clear). The sensor works by activating certain filter groups and converting light intensity into a frequency-modulated output signal.
Most TCS3200D modules have built-in white LEDs that light up the target, providing stable readings regardless of surrounding light and improving performance in dark environments.
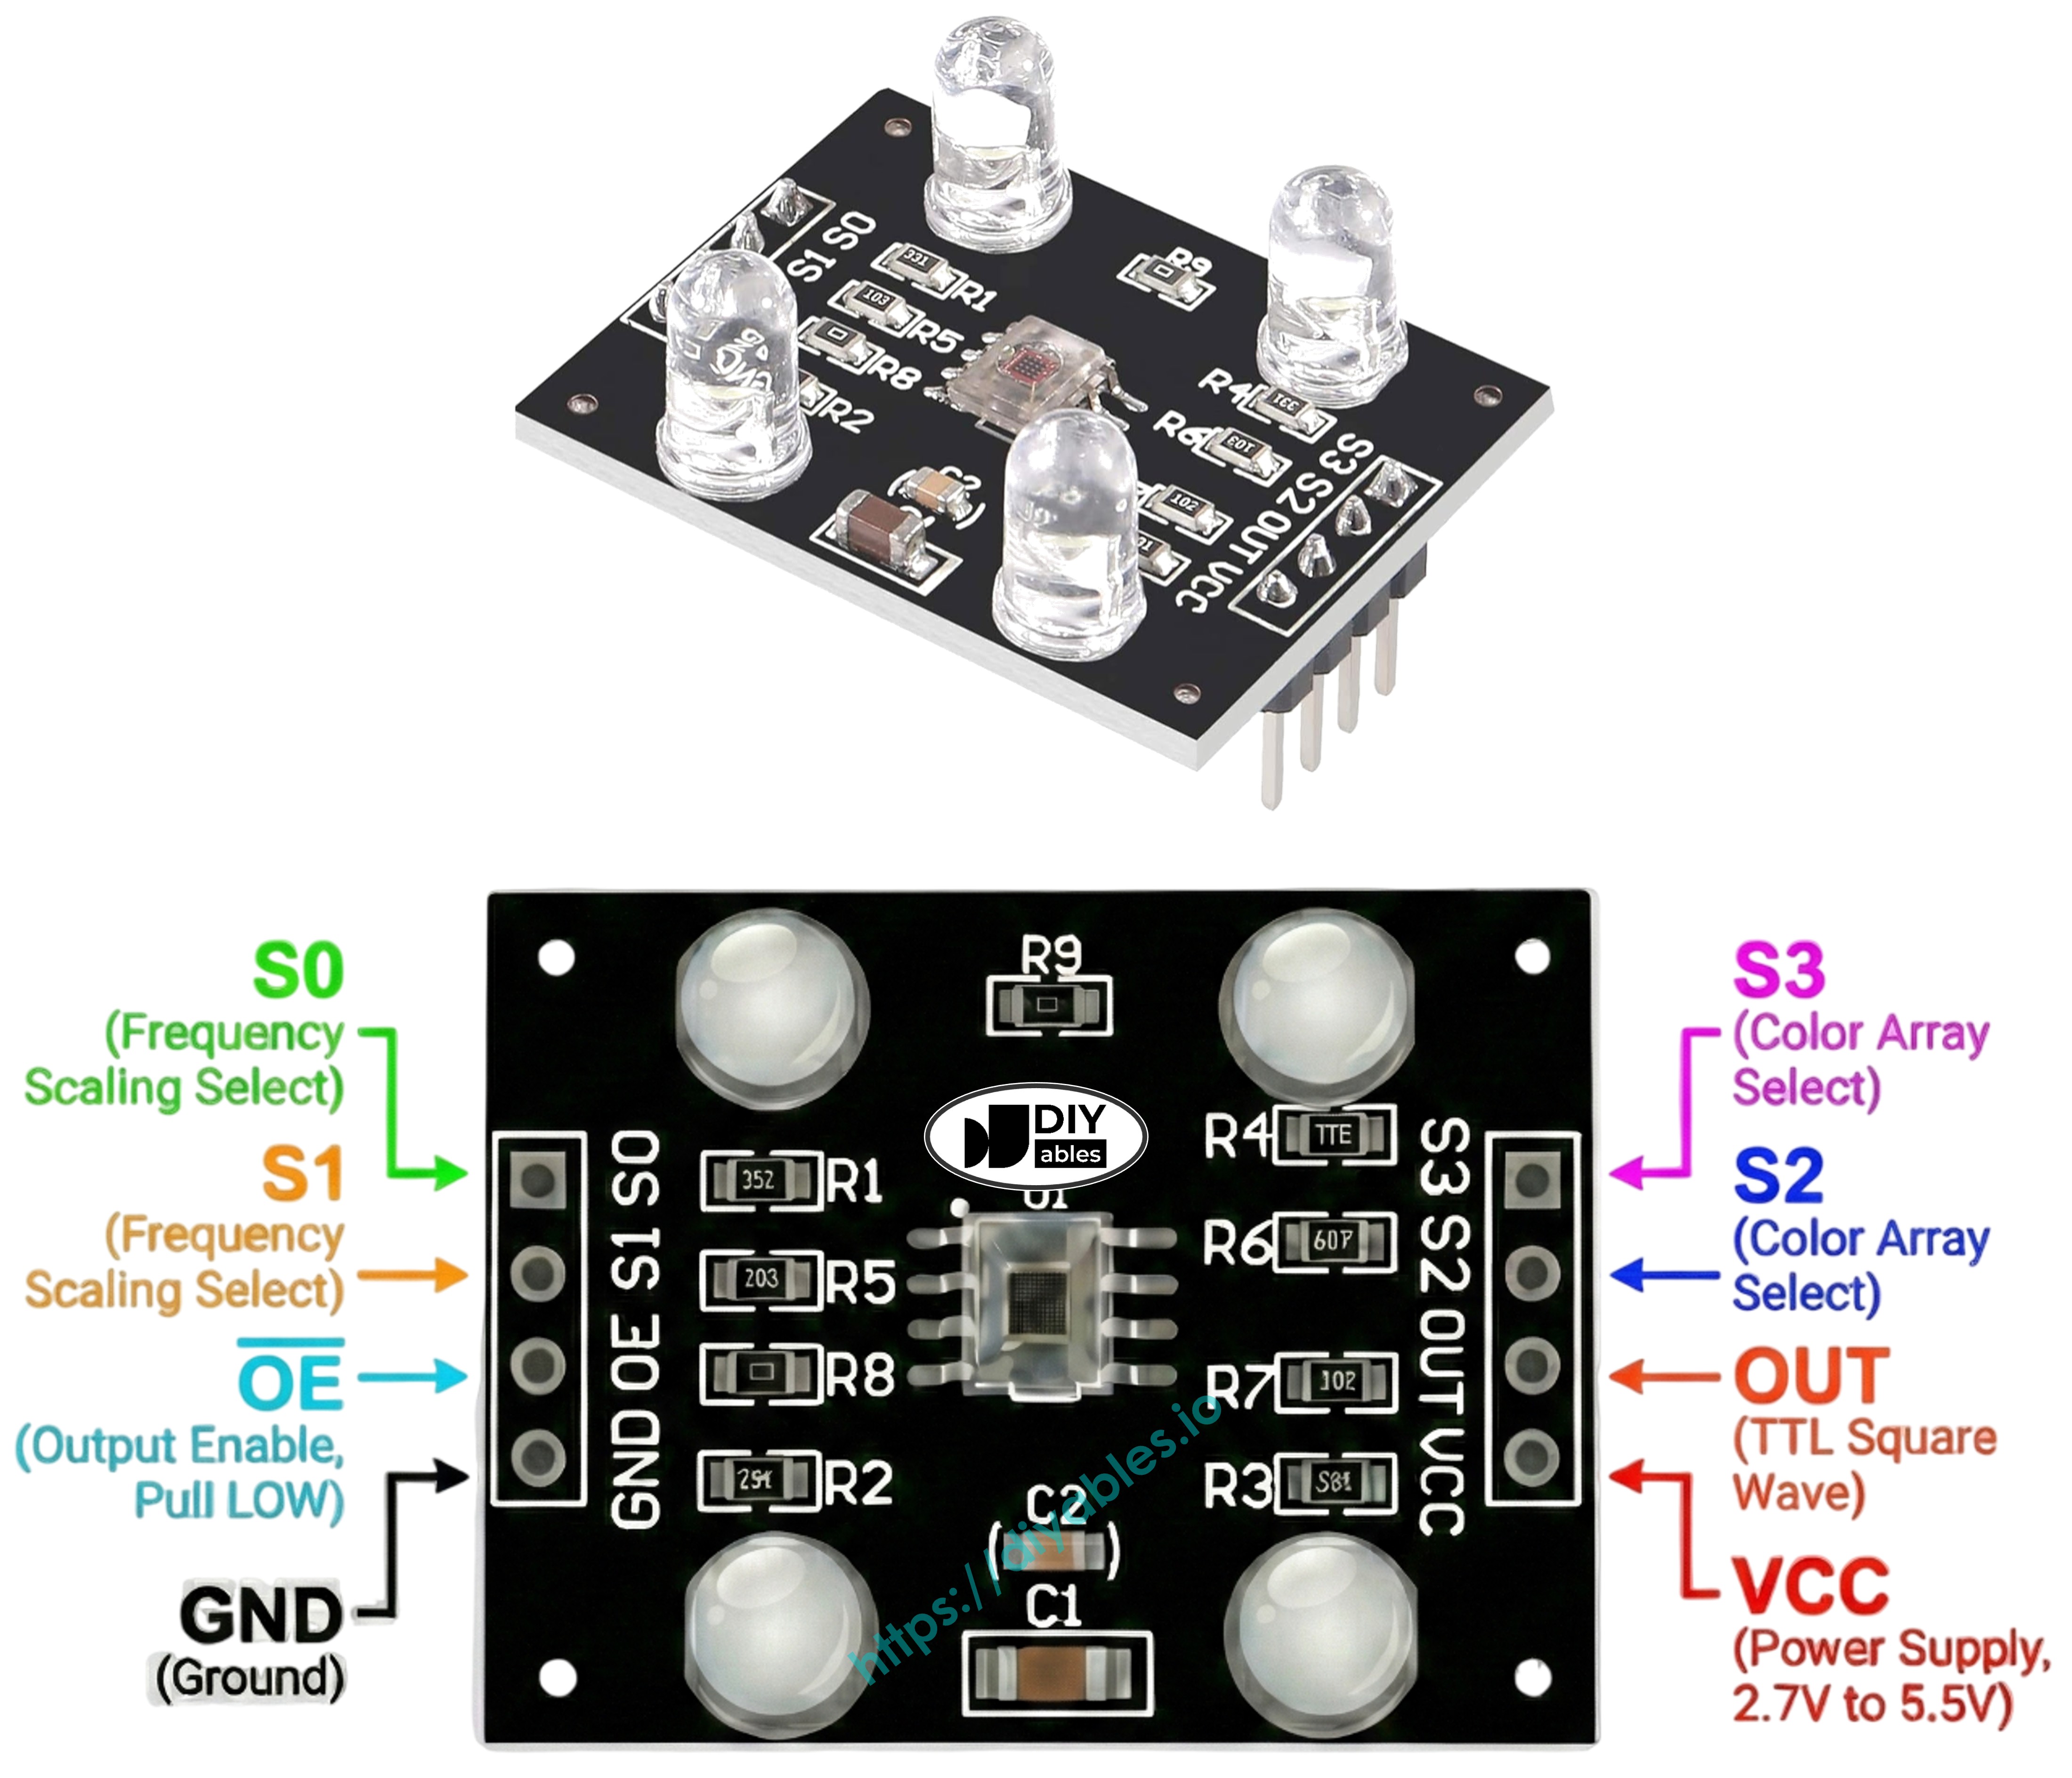
Pinout
The TCS3200D/TCS230 module has these connections:
- VCC pin: Connect to power supply (+5V).
- GND pin: Connect to ground (0V).
- S0, S1 pins: Control output frequency scaling.
- S2, S3 pins: Select color filter channel.
- OUT pin: Frequency-modulated square wave output.
- OE pin: Output enable (active LOW). Usually hard-wired to GND on modules. If not connected, wire to GND manually.
How It Works
The sensor has two main controls: choosing which color filter to use and setting the output signal strength. Two sets of pins handle these:
Output frequency scaling (S0 and S1 pins):
- S0=LOW, S1=LOW: Power down mode
- S0=LOW, S1=HIGH: 2% frequency scaling
- S0=HIGH, S1=LOW: 20% frequency scaling
- S0=HIGH, S1=HIGH: 100% frequency scaling (full speed)
Color filter selection (S2 and S3 pins):
- S2=LOW, S3=LOW: Red filter active
- S2=LOW, S3=HIGH: Blue filter active
- S2=HIGH, S3=LOW: Clear filter (no color filtering)
- S2=HIGH, S3=HIGH: Green filter active
The OUT pin produces square wave frequencies between about 2 Hz and 500 kHz. More light creates higher frequencies. The pulseIn() function measures pulse duration, which works in reverse—brighter light means shorter pulses. After calibration, these readings turn into standard 0-255 RGB values.
Tips for Better Accuracy
- Keep the sensor 1-3 cm from the target with a steady angle.
- Use the built-in white LEDs for consistent lighting.
- Block out changing ambient light for more reliable measurements.
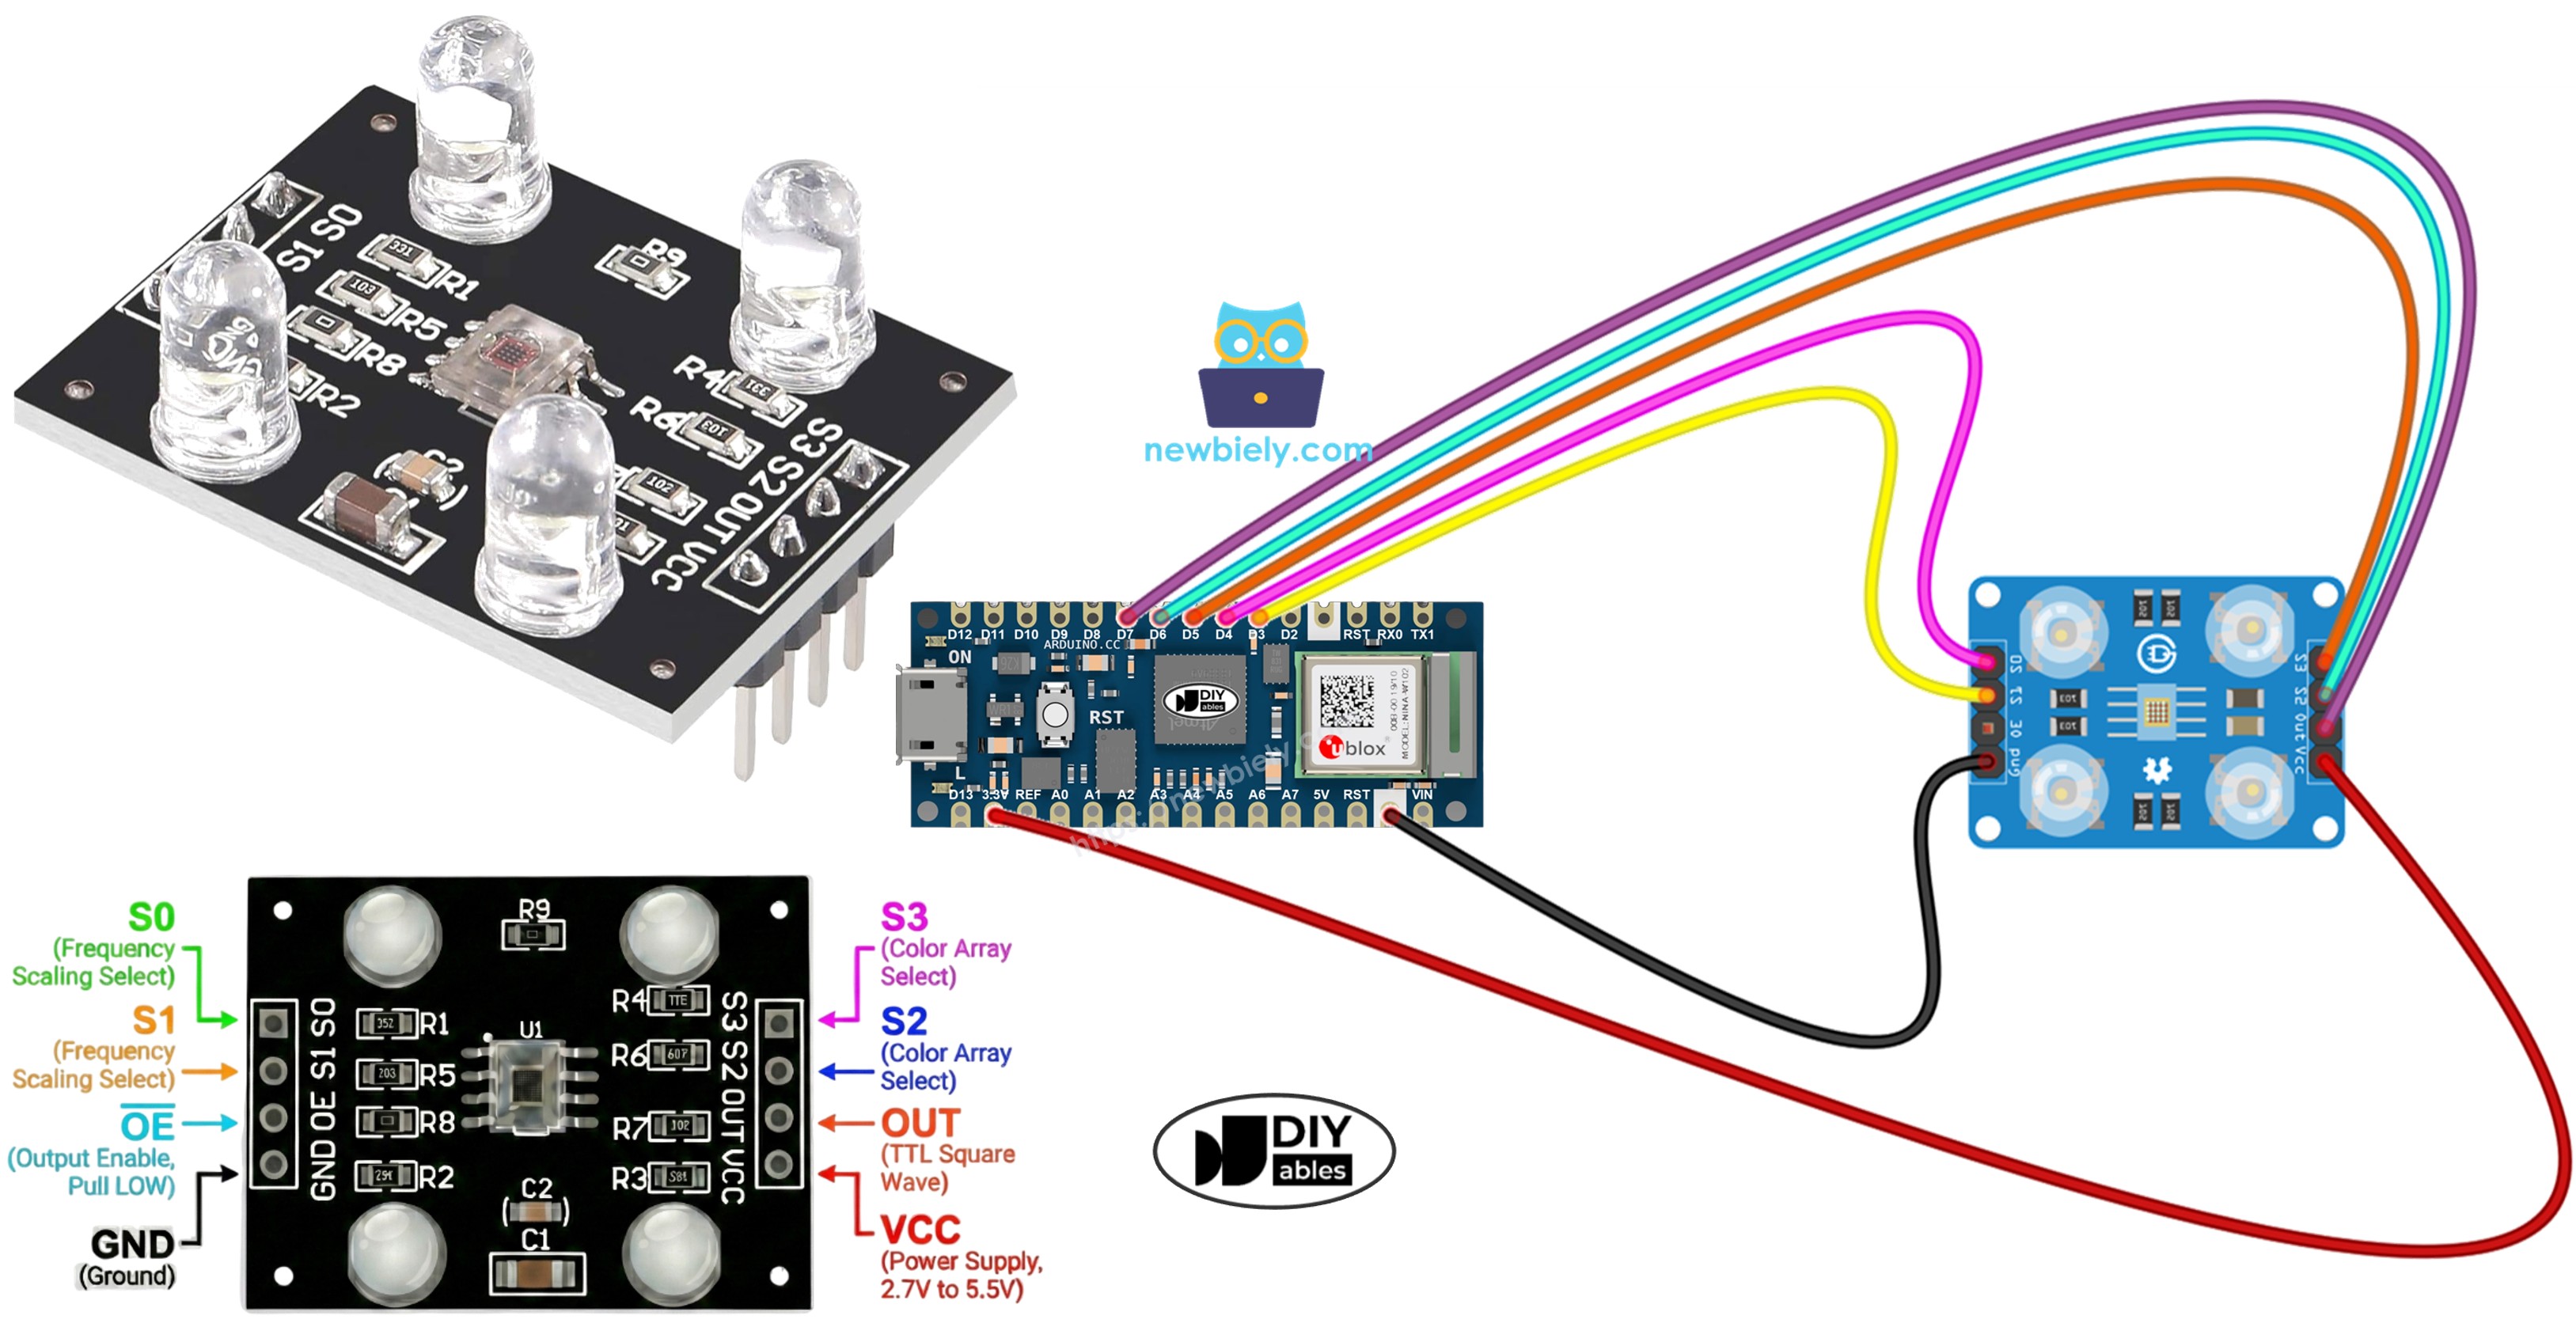
Wiring Diagram
Wire the TCS3200 color sensor to Arduino Nano 33 IoT like this:
| TCS3200 Color Sensor | Arduino Nano 33 IoT |
|---|---|
| VCC | 5V |
| GND | GND |
| S0 | D4 |
| S1 | D3 |
| S2 | D6 |
| S3 | D5 |
| OUT | D7 |
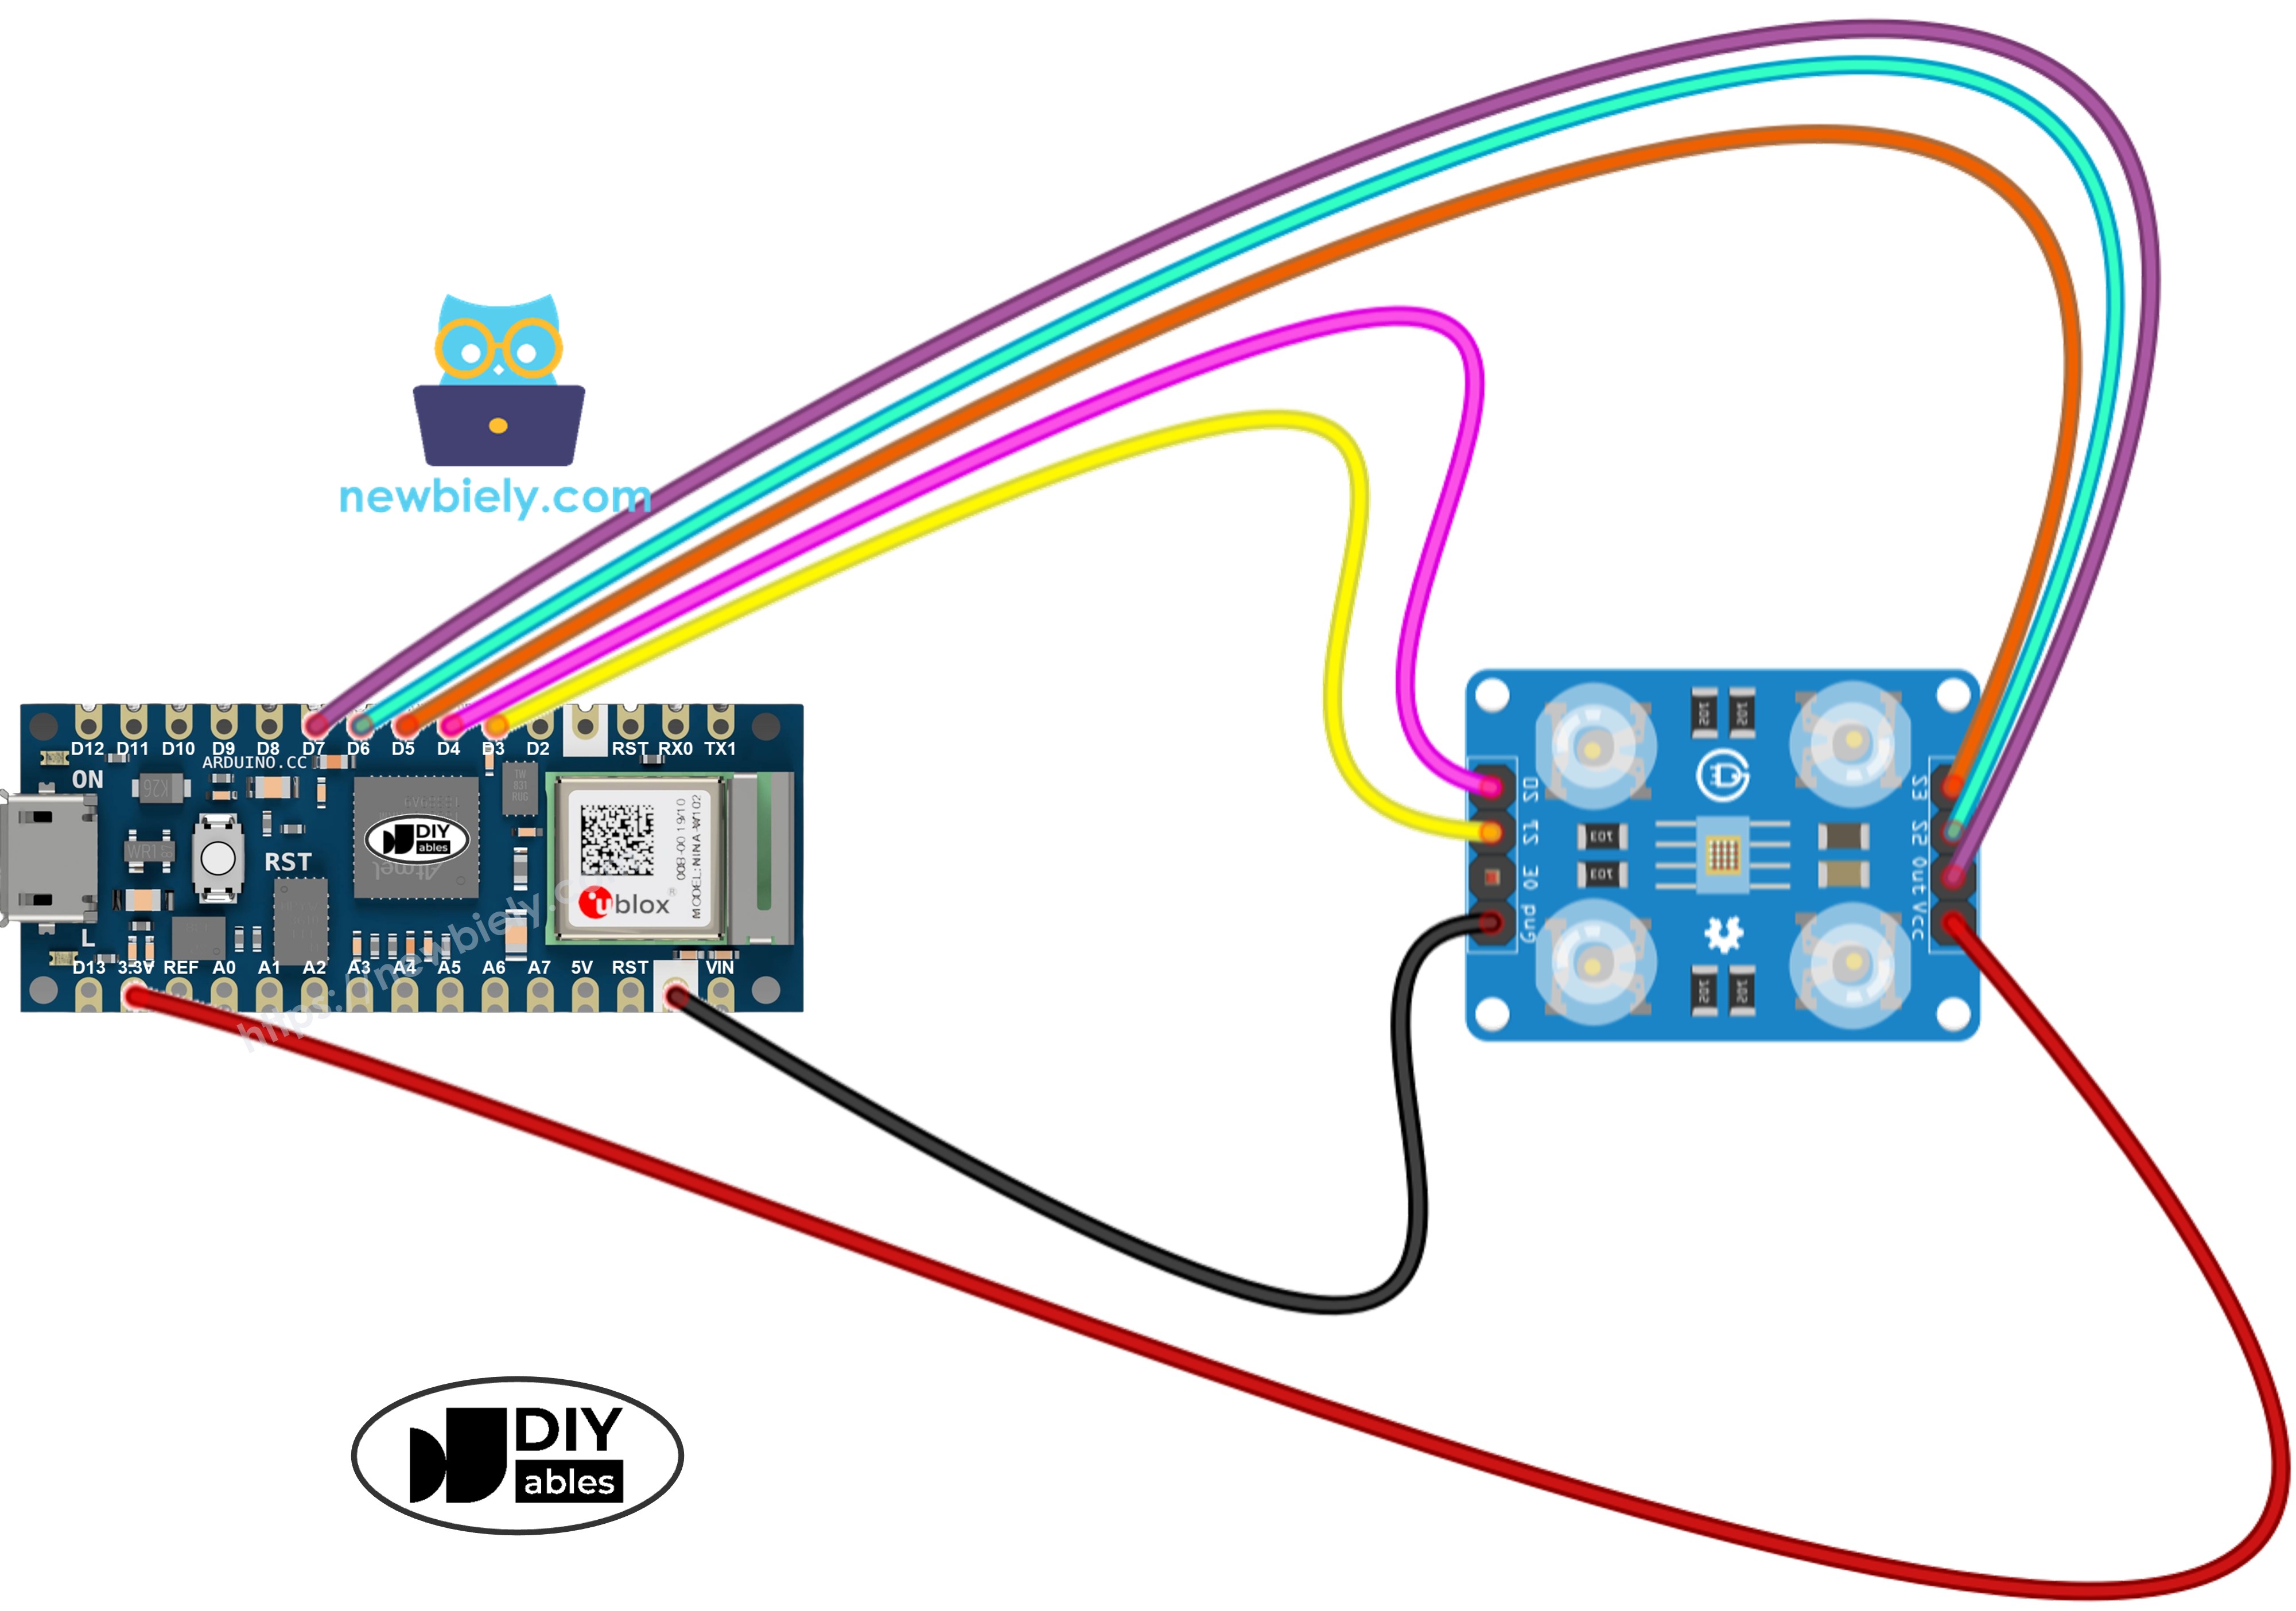
This image is created using Fritzing. Click to enlarge image
Arduino Nano 33 IoT Code - Sensor Calibration
Calibration removes environmental effects from sensor readings. Things like LED brightness, distance to the target, surface type, and room lighting all change the results. The calibration process finds the minimum and maximum pulse widths for each color, creating reference points to convert raw sensor data into accurate 0–255 RGB values for your specific setup.
Detailed Instructions
If you are new to the Arduino Nano 33 IoT, be sure to check out our Getting Started with Arduino Nano 33 IoT tutorial. Then, follow these steps:
- Connect the components to the Arduino Nano 33 IoT board as depicted in the diagram.
- Use a USB cable to connect the Arduino Nano 33 IoT board to your computer.
- Launch the Arduino IDE on your computer.
- Select the appropriate board and port in the Arduino IDE.
- Copy the calibration code and open it in Arduino IDE.
- Click the Upload button to upload code to Arduino Nano 33 IoT.
- Open the Serial Monitor.
- Point the sensor at different colored objects: white paper, black surfaces, and various colors.
- Watch as the Min/Max values update automatically.
- After values stabilize (usually 10-20 seconds), write down all six calibration numbers.
Example calibration values from this output:
- RedMin = 42, redMax = 210
- GreenMin = 55, greenMax = 185
- BlueMin = 60, blueMax = 172
Arduino Nano 33 IoT Code - Reading RGB Values
Detailed Instructions
- Find the calibration variables near the top of the code:
- Replace the zeros with your calibration values. For example (using redMin = 42, redMax = 210, greenMin = 55, greenMax = 185, blueMin = 60, blueMax = 172):
- Upload the code to Arduino Nano 33 IoT.
- Put a colored object in front of the sensor.
- Check the RGB values in Serial Monitor.
The RGB values shown follow the standard 0-255 range. Shorter pulse widths (brighter colors) give higher RGB numbers, while longer pulse widths (darker colors) give lower numbers.
Project Applications
With RGB color detection working, you can build:
- Color sorting machine: Sort items by color (red/green/blue detection)
- Color matching system: Compare colors between objects
- Line following robot: Follow colored lines or paths
- Quality control checker: Find color defects in manufacturing
- Color-based triggers: Start different actions based on detected colors