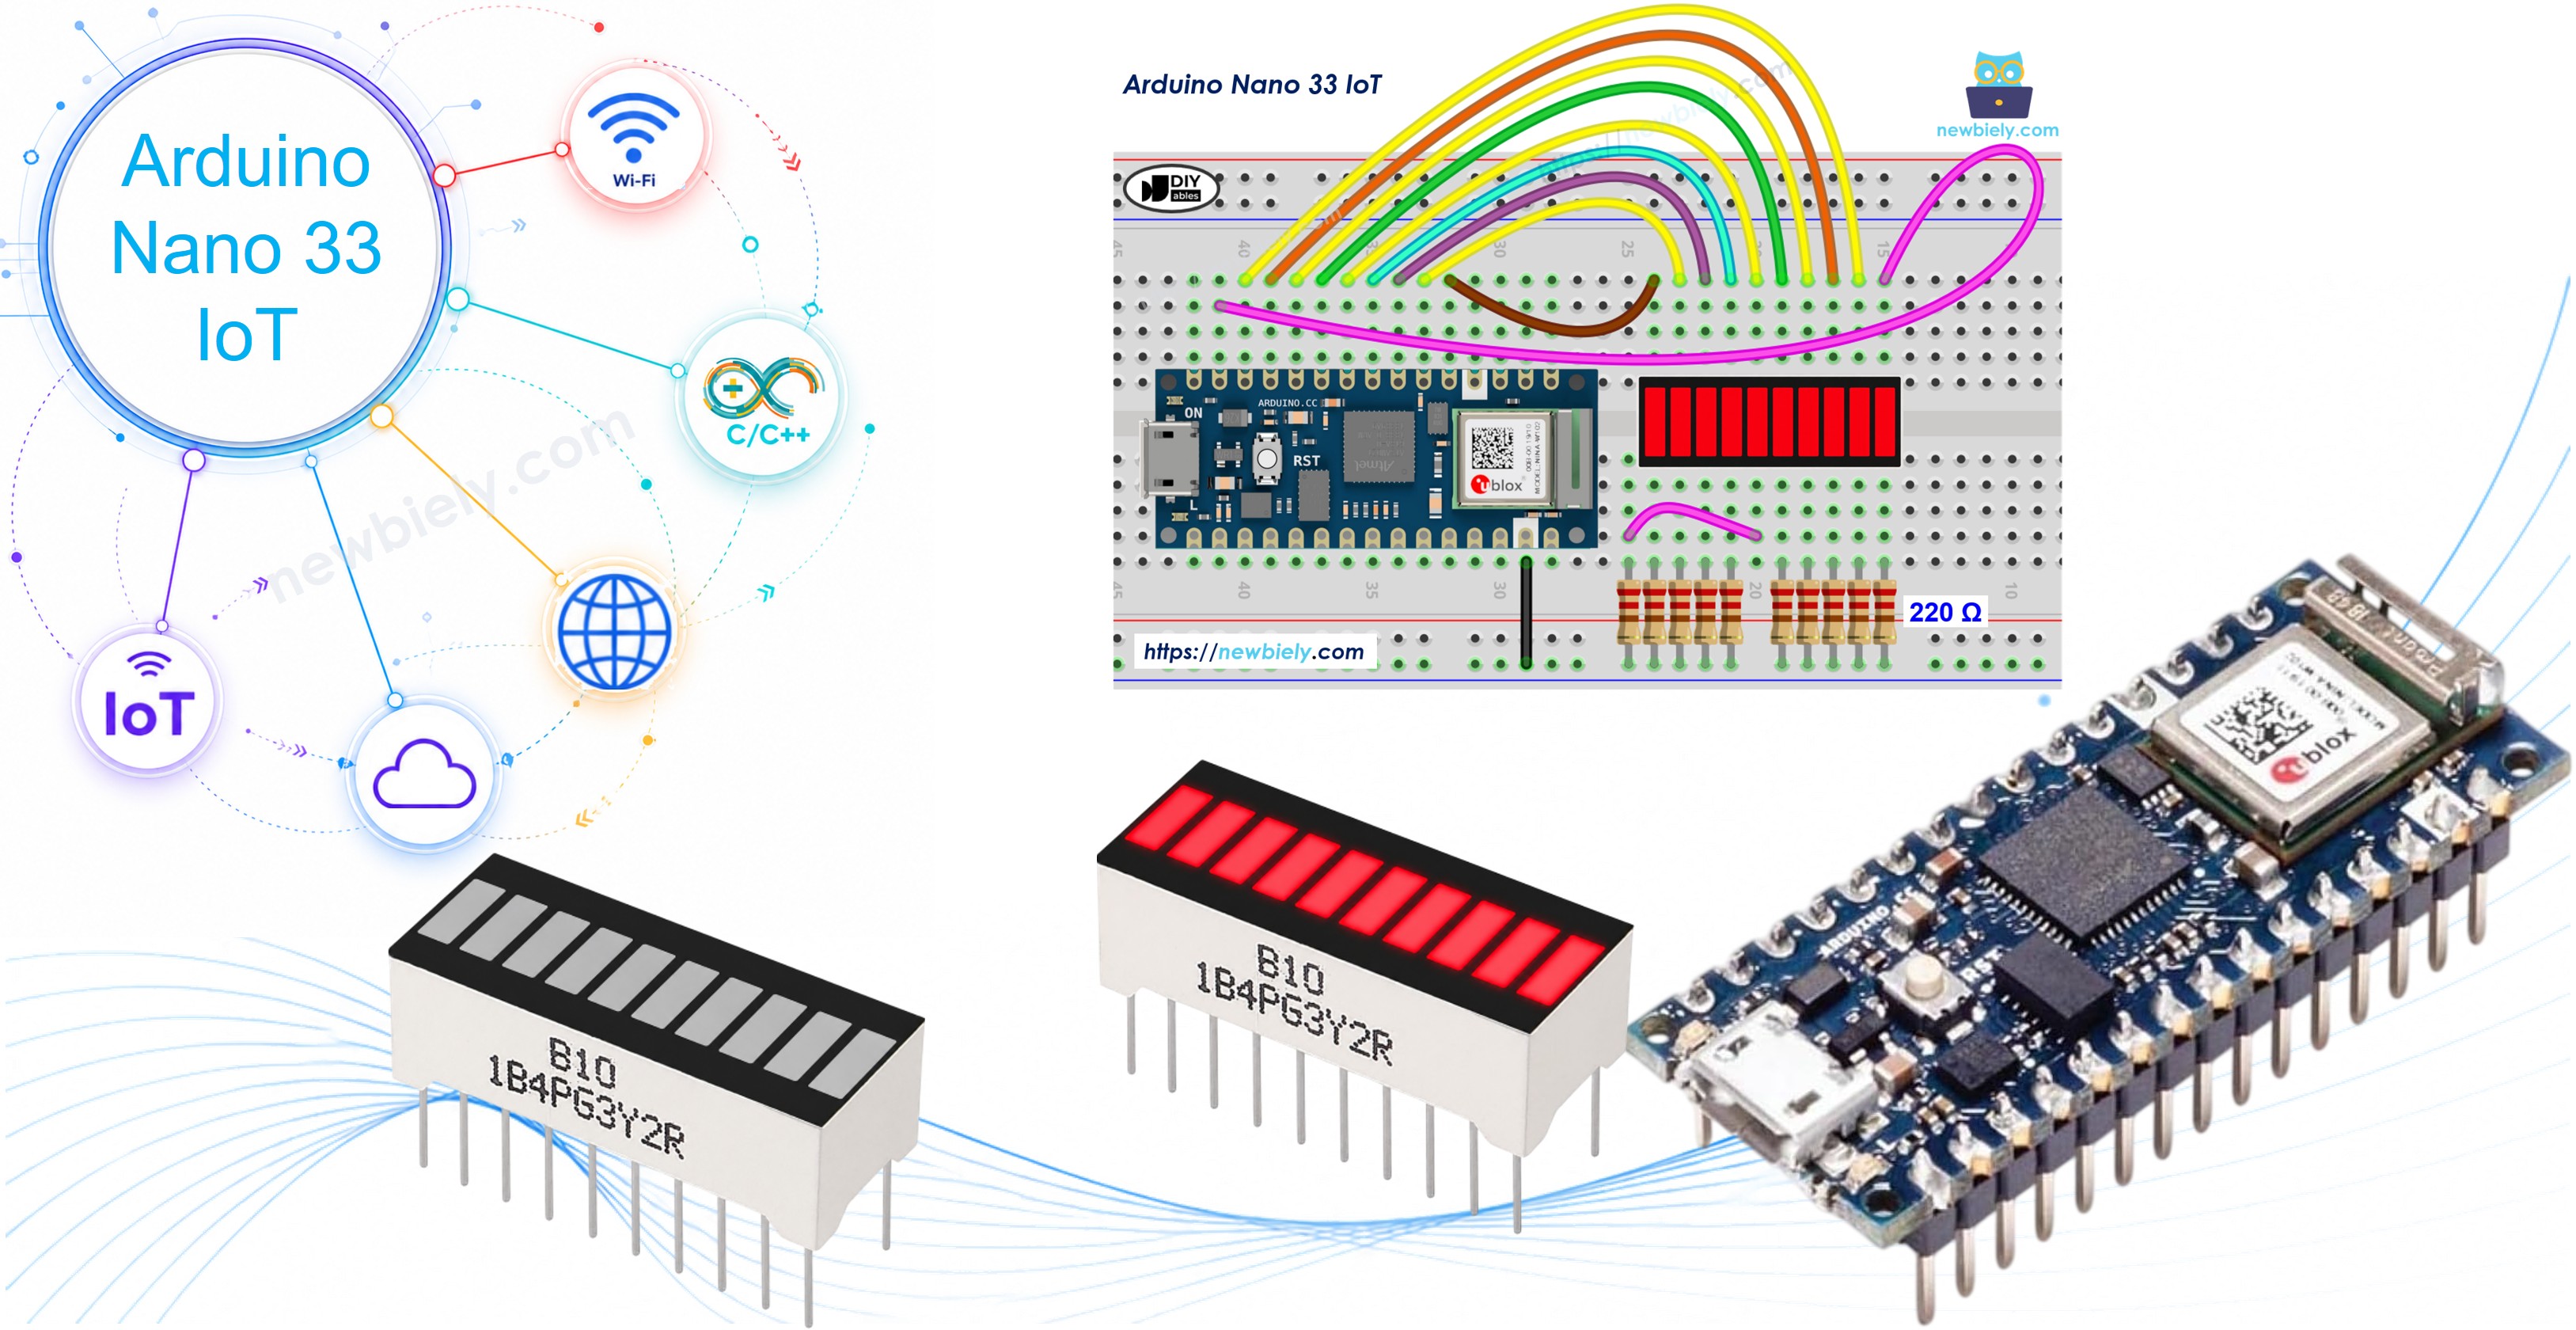
Arduino Nano 33 IoT - 10 Segment LED Bar Graph
Or you can buy the following kits:
| 1 | × | DIYables Sensor Kit (18 sensors/displays) |
Additionally, some of these links are for products from our own brand, DIYables .
This tutorial instructs you how to use Arduino Nano 33 IoT to control the 10 Segment LED Bar Graph display. In detail, we will learn:
- How to connect the Arduino Nano 33 IoT to the 10 Segment LED Bar Graph
- How to program the Arduino Nano 33 IoT to drive the LED bar display
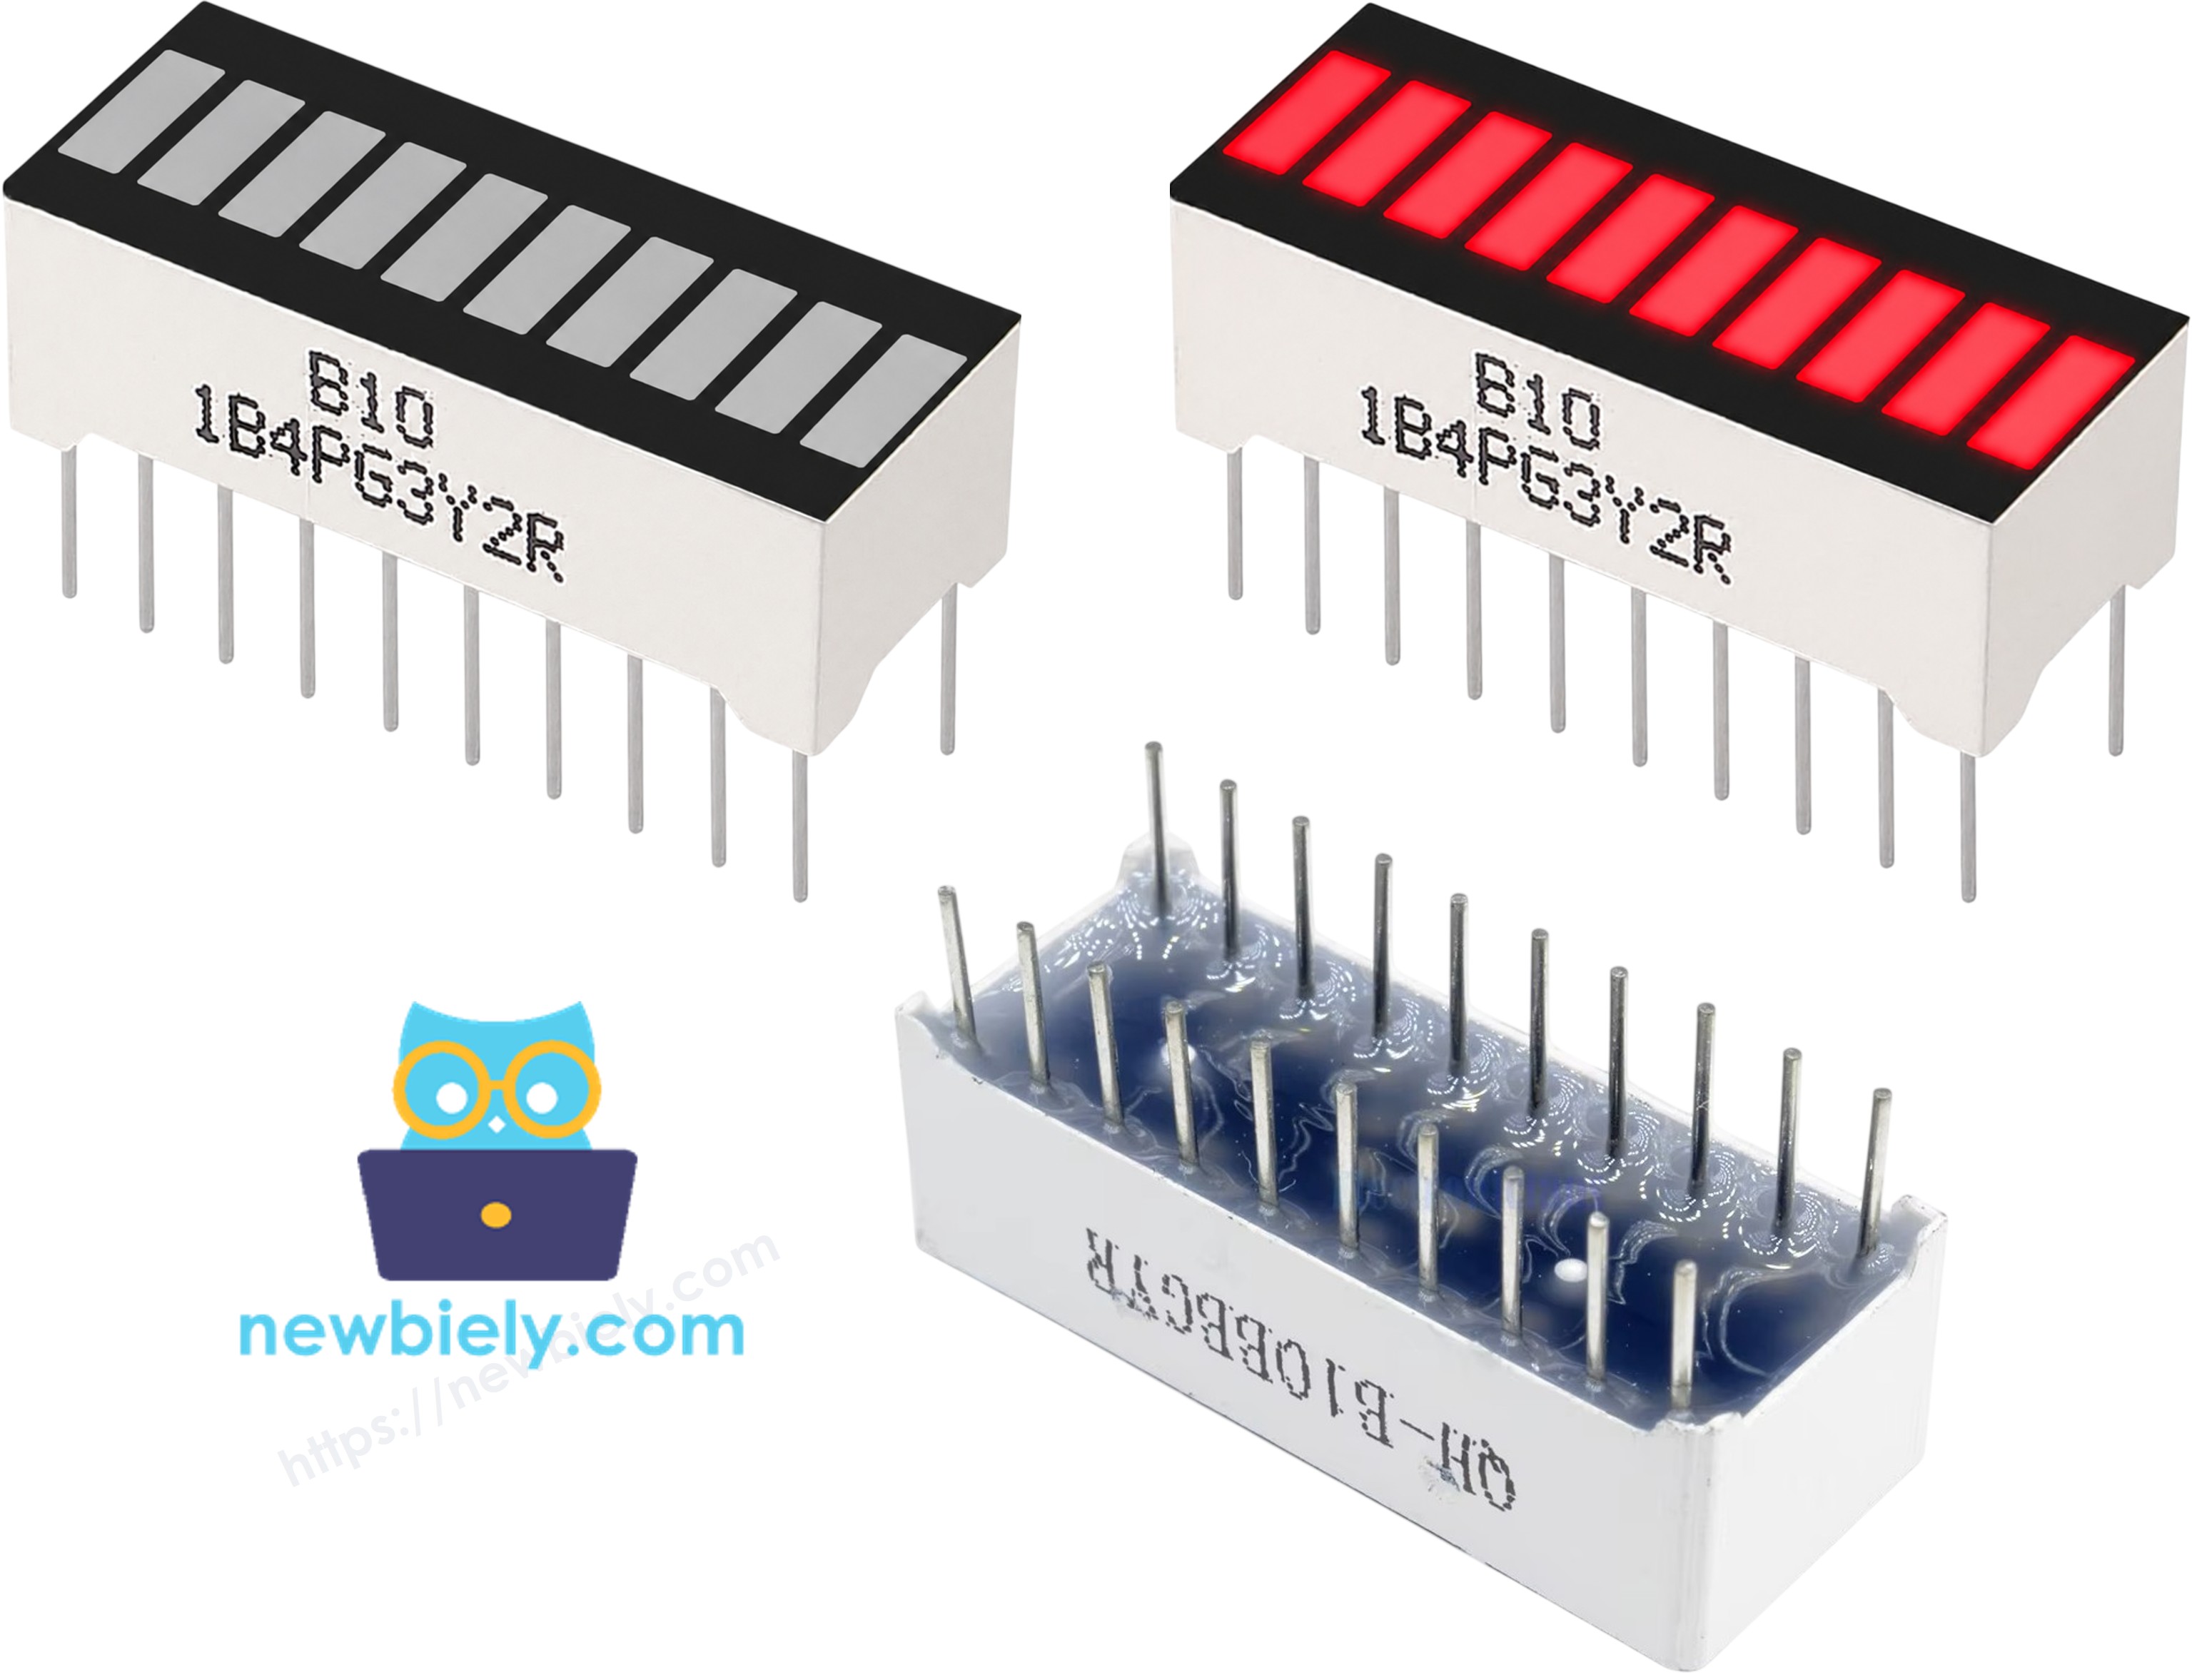
Overview of 10 Segment LED Bar Graph
A 10 Segment LED Bar Graph is a compact display component consisting of ten individual LED segments arranged in a row. Each segment can be controlled independently, making it ideal for visualizing levels, progress, or any value that ranges from 0 to 10.
| 10 Segment LED Bar Graph | |
|---|---|
| Number of Segments | 10 |
| LED Color | Bright red |
| Forward Voltage | ~2V per segment |
| Forward Current | 20mA max per segment |
| Resistor Required | 220Ω per segment |
The 10 Segment LED Bar Graph Pinout
The component has two rows of pins — anodes and cathodes — one per segment:
- Anode pins (A1–A10): must be connected to GPIO pins via 220Ω resistors
- Cathode pins (K1–K10): must be connected to GND
※ NOTE THAT:
Pin numbering on LED bar graphs can vary between manufacturers. It is essential to always verify the anode and cathode orientation before wiring. Refer to the datasheet or check the component labeling carefully.
Wiring Diagram
Connect the 10 Segment LED Bar Graph to the Arduino Nano 33 IoT as shown in the table below.
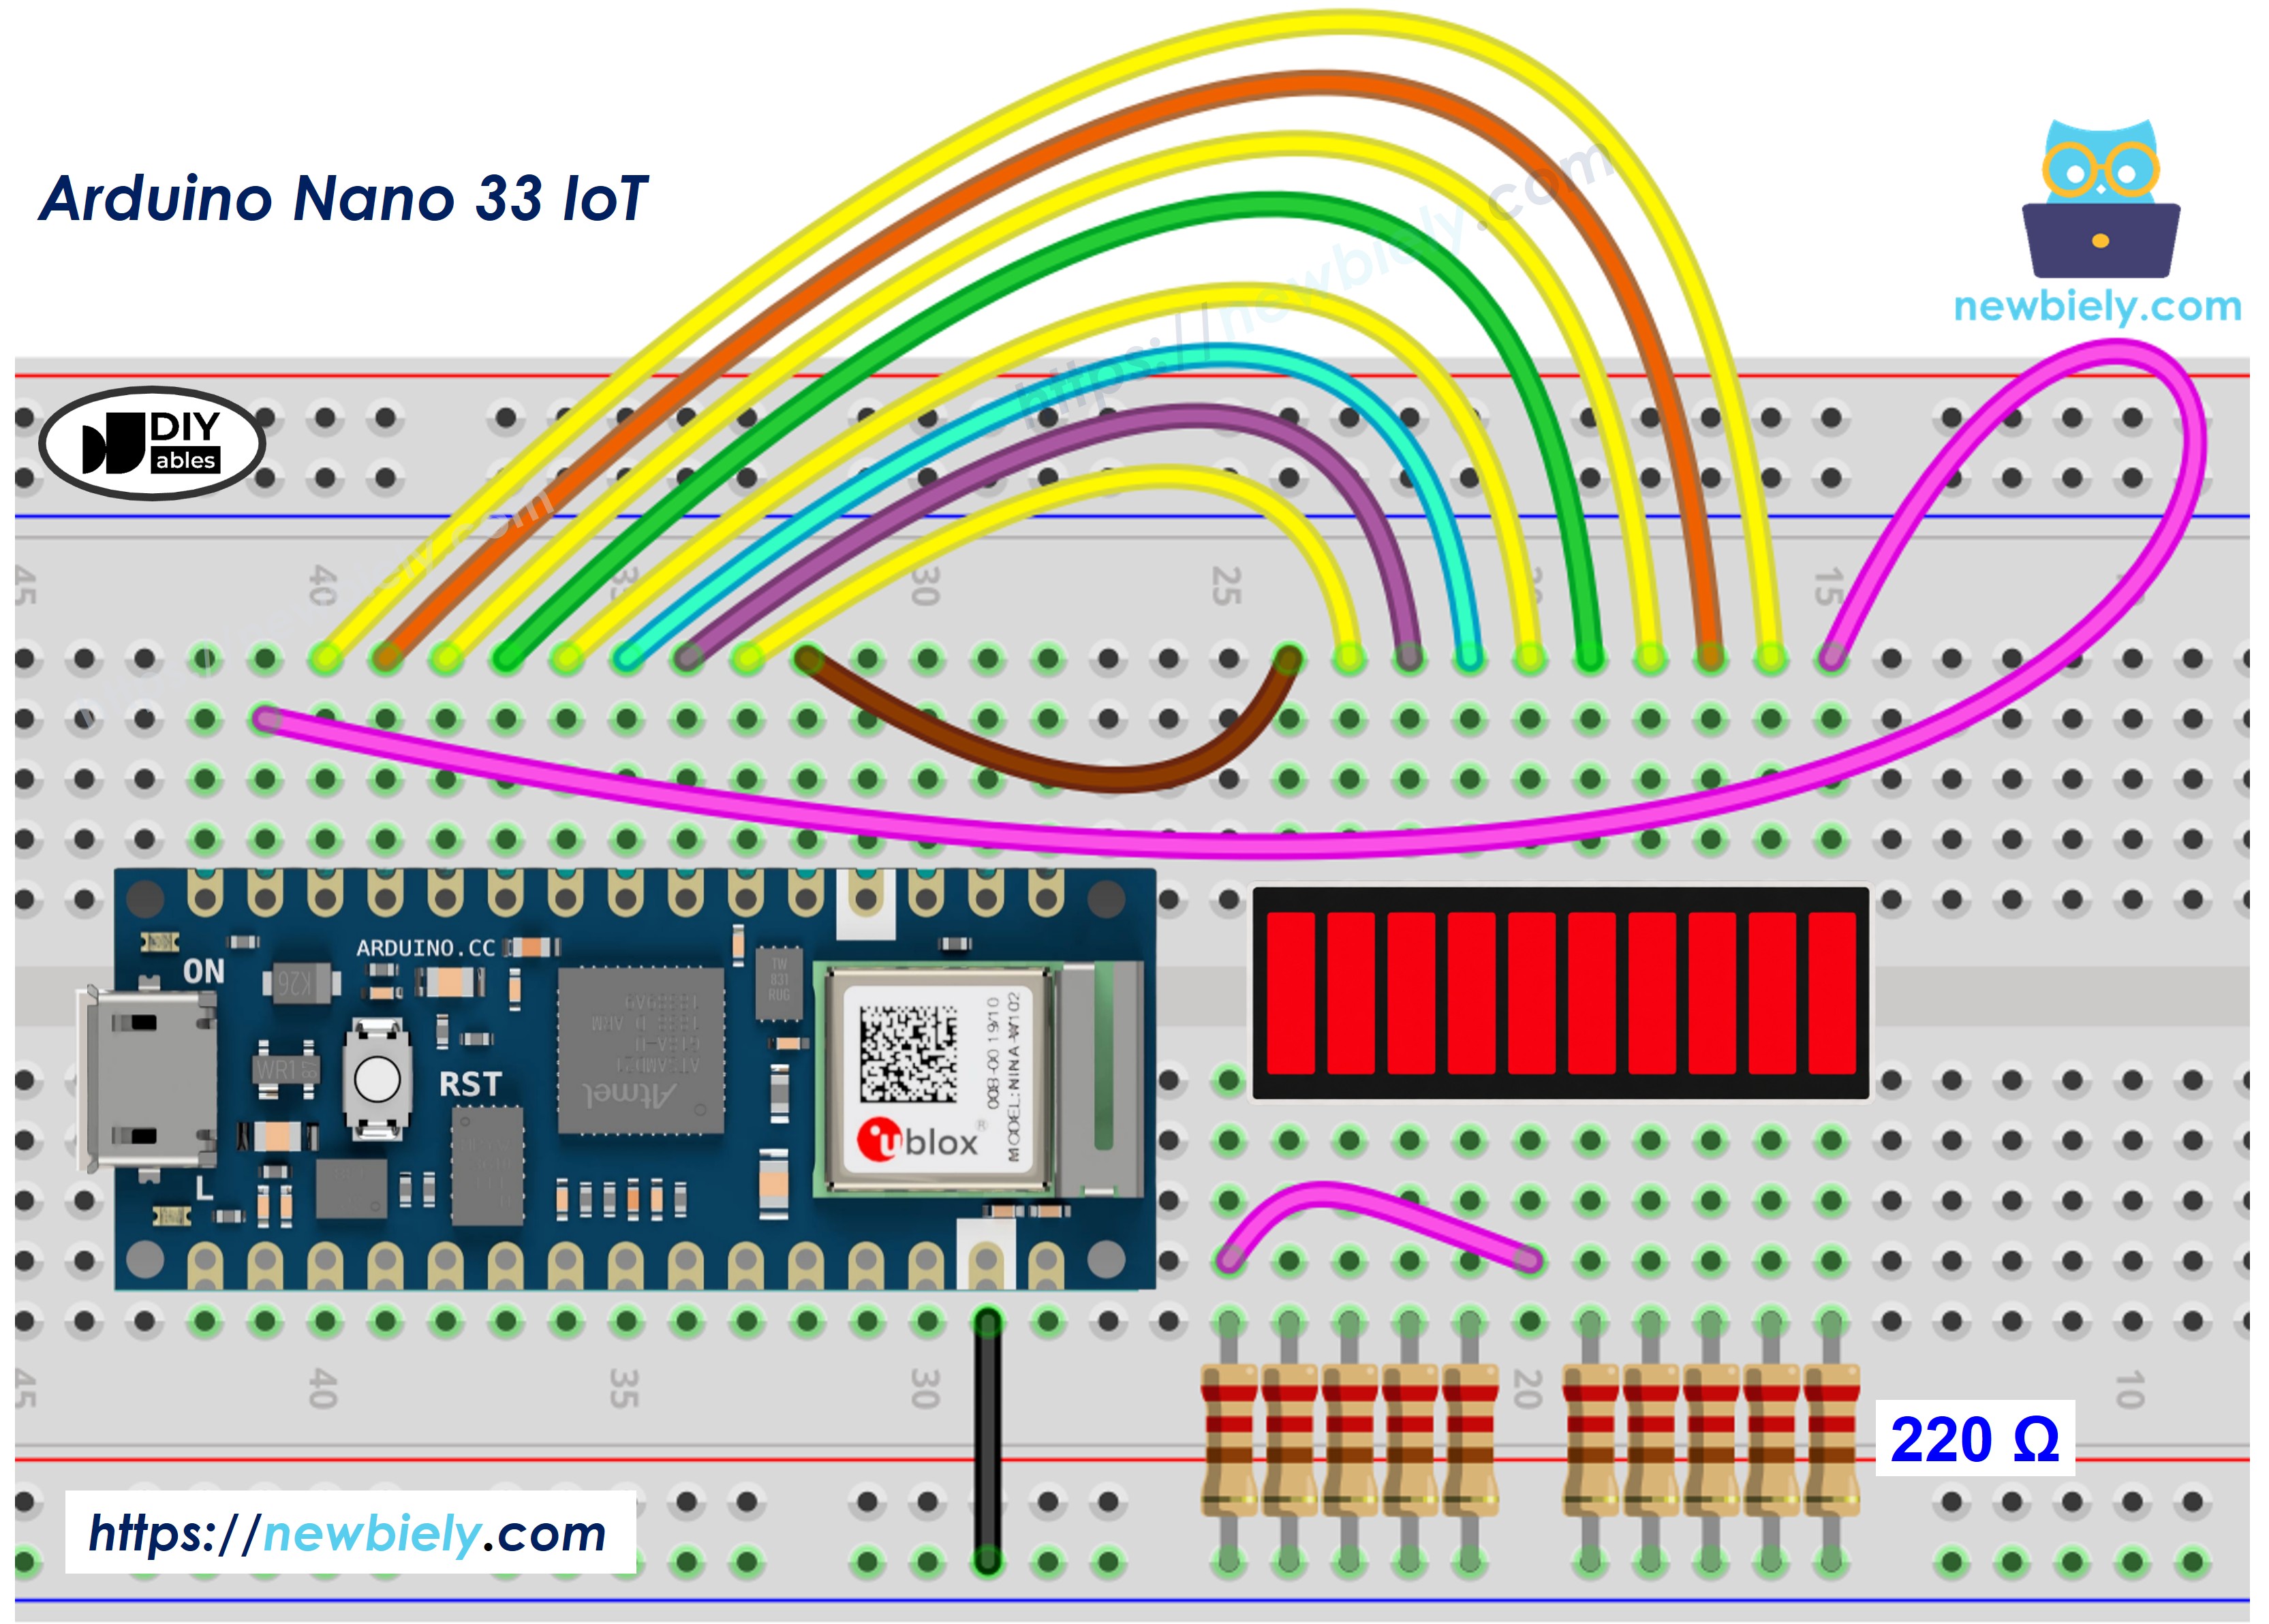
This image is created using Fritzing. Click to enlarge image
| LED Bar Graph | Arduino Nano 33 IoT Pin |
|---|---|
| A1 (Anode 1) | Pin 2 (via 220Ω) |
| A2 (Anode 2) | Pin 3 (via 220Ω) |
| A3 (Anode 3) | Pin 4 (via 220Ω) |
| A4 (Anode 4) | Pin 5 (via 220Ω) |
| A5 (Anode 5) | Pin 6 (via 220Ω) |
| A6 (Anode 6) | Pin 7 (via 220Ω) |
| A7 (Anode 7) | Pin 8 (via 220Ω) |
| A8 (Anode 8) | Pin 9 (via 220Ω) |
| A9 (Anode 9) | Pin 10 (via 220Ω) |
| A10 (Anode 10) | Pin 11 (via 220Ω) |
| K1–K10 (Cathodes) | GND |
How To Program Arduino Nano 33 IoT for 10 Segment LED Bar Graph
- The first step is to specify the pins connected to the anode pins of the LED bar graph
- Configure each pin as digital output using pinMode()
- Set a GPIO pin HIGH to illuminate the corresponding LED segment
- Set a GPIO pin LOW to turn off the segment
- No external library is required for this project
Arduino Nano 33 IoT Code for 10 Segment LED Bar Graph
Detailed Instructions
If this is the first time you use Arduino Nano 33 IoT, see how to set up the environment for Arduino Nano 33 IoT in Arduino IDE.
- Wire the components as shown in the diagram.
- Connect the Arduino Nano 33 IoT board to your computer using a Micro USB cable.
- Open the Arduino IDE on your computer.
- Select the correct board: go to Tools → Board → Arduino SAMD Boards → Arduino NANO 33 IoT.
- Select the correct COM port: go to Tools → Port and choose the port associated with your Arduino Nano 33 IoT.
- Copy the code above and paste it into the Arduino IDE.
- Click the Upload button to compile and upload the code to the board.
- Open the Serial Monitor: go to Tools → Serial Monitor, and set the baud rate to 9600.
- Observe the LED bar graph fill segment by segment from left to right, then empty from right to left in a repeating animation.
Serial Monitor Output
Additional Knowledge
The LED bar graph project can be extended in a number of practical ways:
Reading an analog sensor to drive the bar: An analog sensor such as a potentiometer or an LDR (light-dependent resistor) can be connected to one of the Arduino Nano 33 IoT's analog input pins. The analog reading (0–1023) can then be mapped to the number of lit segments (0–10) using the map() function:
This allows the LED bar to visually represent the sensor level in real time.
Wireless streaming with Arduino Nano 33 IoT: The Arduino Nano 33 IoT includes built-in Wi-Fi and Bluetooth via the u-blox NINA-W102 module. This wireless capability can be used to transmit the current LED bar state — for example, the number of lit segments — to a remote dashboard, a mobile application, or a web browser. The WiFiNINA library provides straightforward support for establishing Wi-Fi connections and sending data over TCP or UDP sockets. Similarly, the ArduinoBLE library can be used to broadcast the bar state over Bluetooth Low Energy to a paired device.