
DIYables Web Apps Web Plotter

Overview

This ESP32 S3 Uno web plotter tutorial shows you how to turn sensor data into a live chart that you can open in any web browser. You use the DIYables ESP32 WebApps library on the ESP32 S3 Uno form board, so you do not need to write any HTML or JavaScript. The data travels over WebSocket, and the real-time plot updates on your phone or PC while the board is running.

In this tutorial, you will:

  1. Install the DIYables ESP32 WebApps library in Arduino IDE
  2. Run the WebPlotter example and open the plot page over WiFi
  3. Send real sensor readings to the web-based chart instead of simulated data
  4. Change the plot title, axis labels and Y-axis range
  5. Plot DHT11 temperature and humidity data in real time
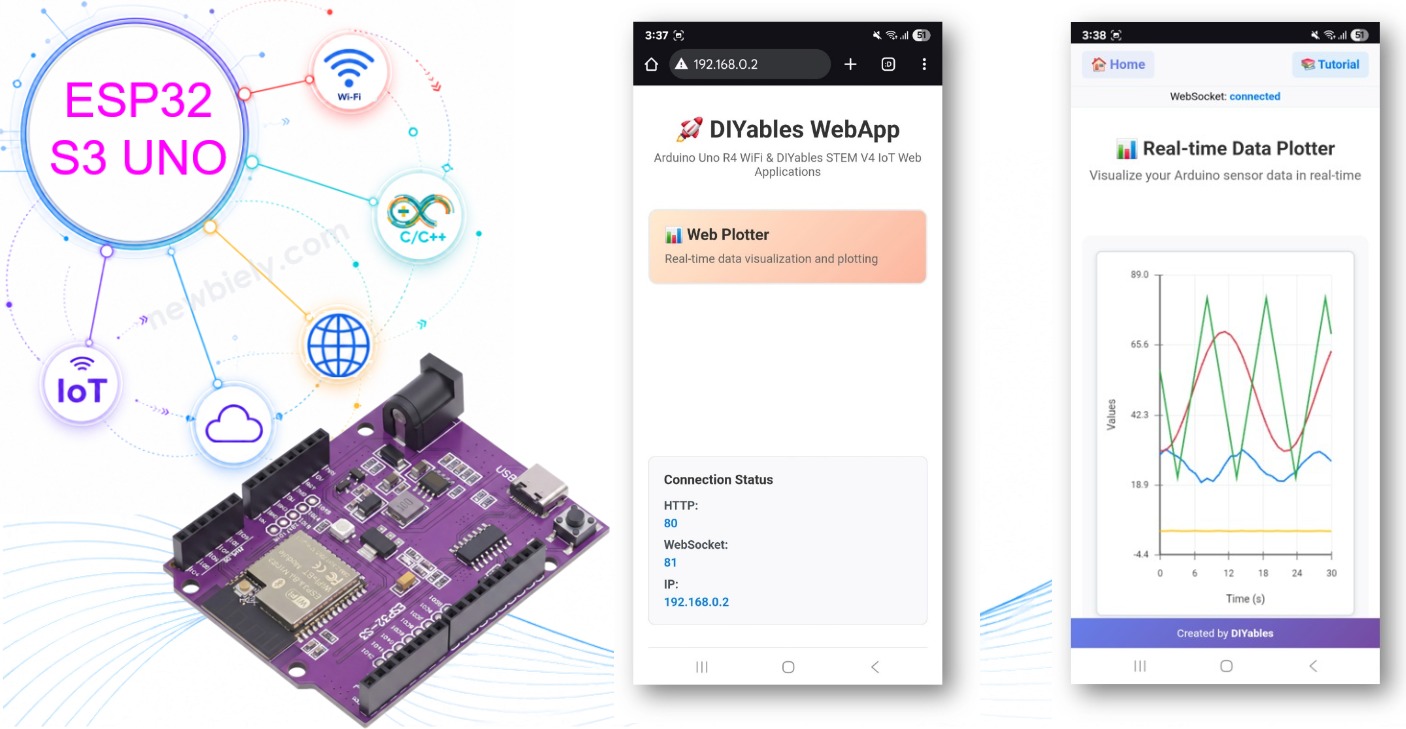
ESP32 S3 Uno web plotter

Watch this video to see the Web Plotter app working with a DHT sensor:

Features

A plot shows you in one look what a column of numbers in the Serial Monitor cannot: trends, spikes and noise. The Web Plotter app brings this view to your browser, and it works without a USB cable once the code is running.

Real-time plotting

New values appear on the chart as soon as the ESP32 S3 Uno sends them, so you watch your sensor change live.

Up to 8 data series

You can draw up to eight lines at the same time, each in its own color. This is handy when you compare several sensors.

Automatic Y-axis scaling

The chart can adjust the Y-axis to fit your data, so you do not have to guess the range in advance.

Interactive chart

You can zoom and pan to look closer at a part of the data.

Fast WebSocket link

Data goes from the board to the browser over WebSocket, so the delay is very small.

Works on any device

The page is responsive. It runs in the browser of a phone, tablet or computer on the same WiFi network.

Easy to configure

You set the plot title, the axis labels and the Y-axis range with a few lines of code.

Hardware Preparation

1×ESP32 S3 Uno-form Board
1×USB Cable Type-A to Type-C (for USB-A PC)
1×USB Cable Type-C to Type-C (for USB-C PC)

Or you can buy the following kits:

1×DIYables Sensor Kit (18 sensors/displays)
Disclosure: Some of the links provided in this section are Amazon affiliate links. We may receive a commission for any purchases made through these links at no additional cost to you.
Additionally, some of these links are for products from our own brand, DIYables .

ESP32 S3 Uno Pinout

The image below shows the pinout diagram of the ESP32 S3 Uno form board. Use it to find the Uno header pins (A0, D2…) and their GPIO numbers when you connect your own sensors to the plotter.
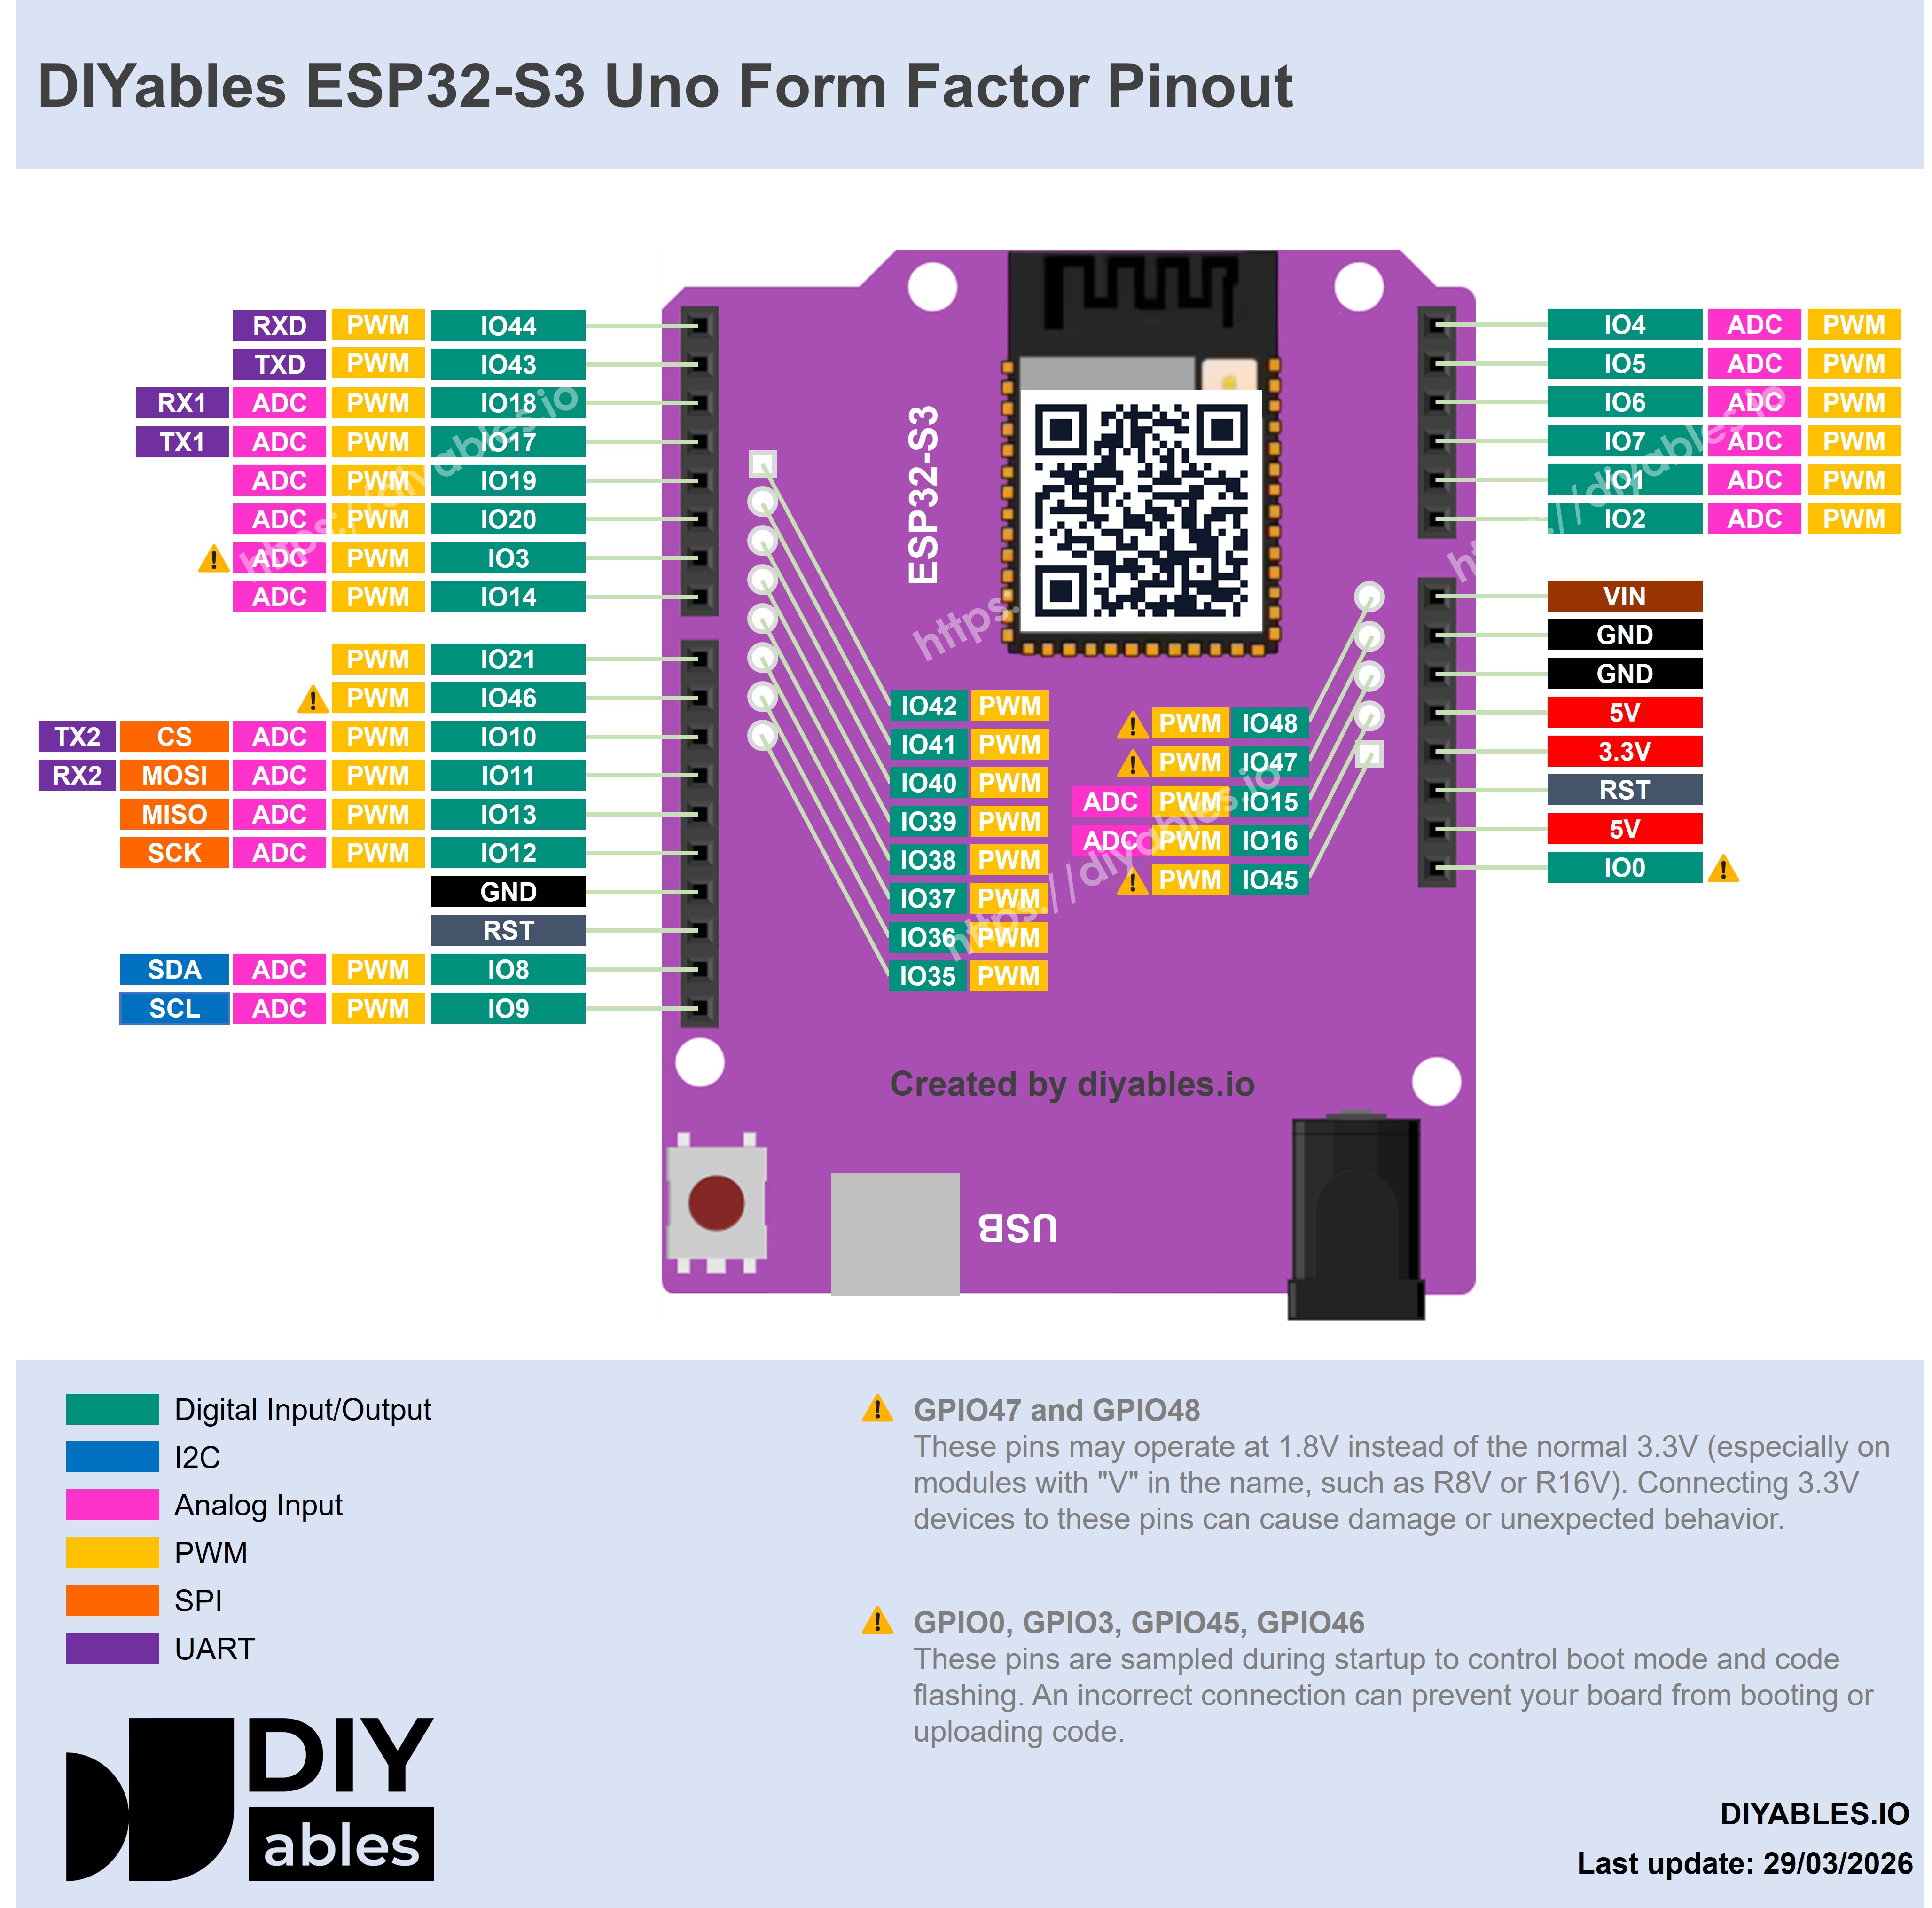
ESP32 S3 Uno pinout diagram

Setup Instructions

Detailed Instructions

The basic example needs no wiring. It makes simulated data and also reads pin A0 (GPIO2), so you can test the plotter with just the board and a USB cable.

  1. New to the ESP32 S3 Uno? Follow ESP32 S3 Uno - Getting Started first.
  2. Wire it up: no wiring is needed for this example. You can add a sensor on A0 (GPIO2) later.
  3. Connect the board to your computer with a USB Type-C cable.
  4. Open Arduino IDE, choose the ESP32S3 Dev Module board and the correct COM port.
  5. Open the Library Manager by clicking the Libraries icon on the left bar of Arduino IDE.
  6. Search the library: type "DIYables ESP32 WebApps" and find the DIYables ESP32 WebApps Library by DIYables.
  7. Install it: click the Install button.
  • Search for DIYables ESP32 WebApps created by DIYables and click the Install button.
∞
Newbiely | Arduino IDE 2.3.8
──
☐
✕
File
Edit
Sketch
Tools
Help
ESP32S3 Dev Module
Library Manager
Type:
All
Topic:
All
DIYables ESP32 WebApps by DIYables
A comprehensive library designed for ESP32 that provides multiple professional web applications including Web Monitor, Chat, Digital Pin Control, Sliders, Joystick, Analog Gauge, Rotator Control, and Temperature Display via WebSocket communication. Features modular architecture for memory efficiency, automatic config handling, and perfect for IoT projects, robotics, sensor monitoring, servo/stepper control, temperature monitoring, and remote ESP32 control. More info
1.0.1
INSTALL
Newbiely.ino
···
1 void setup() {
Output
Serial Monitor
Ln 1, Col 1
ESP32S3 Dev Module on COM15
1
  1. Install the dependencies: Arduino IDE asks to install some other libraries. Click Install All.
  2. Open the example: go to File Examples DIYables ESP32 WebApps WebPlotter, or copy the code below into Arduino IDE. The code below uses analogRead(2) for A0 and sets the ADC attenuation for the ESP32 S3 Uno.
/* * DIYables WebApp Library - Web Plotter Example * * This example demonstrates the Web Plotter feature: * - Real-time data visualization * - Multiple data series support * - Auto-scaling Y-axis * - Responsive web interface * - WebSocket communication for instant updates * * Hardware: ESP32 S3 Uno * * Setup: * 1. Update WiFi credentials below * 2. Upload the sketch to your ESP32 S3 Uno * 3. Open Serial Monitor to see the IP address * 4. Navigate to http://[IP_ADDRESS]/web-plotter */ #include <DIYables_ESP32_Platform.h> #include <DIYablesWebApps.h> // WiFi credentials - UPDATE THESE WITH YOUR NETWORK const char WIFI_SSID[] = "YOUR_WIFI_SSID"; const char WIFI_PASSWORD[] = "YOUR_WIFI_PASSWORD"; // Create WebApp server and page instances ESP32ServerFactory serverFactory; DIYablesWebAppServer webAppsServer(serverFactory, 80, 81); DIYablesHomePage homePage; DIYablesWebPlotterPage webPlotterPage; // Simulation variables unsigned long lastDataTime = 0; const unsigned long DATA_INTERVAL = 1000; // Send data every 1000ms float timeCounter = 0; void setup() { Serial.begin(9600); // set the ADC attenuation to 11 dB (up to ~3.3V input) analogSetAttenuation(ADC_11db); delay(1000); // TODO: Initialize your hardware pins and sensors here Serial.println("DIYables ESP32 WebApp - Web Plotter Example"); // Add home and web plotter pages webAppsServer.addApp(&homePage); webAppsServer.addApp(&webPlotterPage); // Optional: Add 404 page for better user experience webAppsServer.setNotFoundPage(DIYablesNotFoundPage()); // Configure the plotter webPlotterPage.setPlotTitle("Real-time Data Plotter"); webPlotterPage.setAxisLabels("Time (s)", "Values"); webPlotterPage.enableAutoScale(true); webPlotterPage.setMaxSamples(50); // Start the WebApp server if (!webAppsServer.begin(WIFI_SSID, WIFI_PASSWORD)) { while (1) { Serial.println("Failed to start WebApp server!"); delay(1000); } } // Set up callbacks webPlotterPage.onPlotterDataRequest([]() { Serial.println("Web client requested data"); sendSensorData(); }); Serial.println("\nWebPlotter is ready!"); Serial.println("Usage Instructions:"); Serial.println("1. Connect to the WiFi network"); Serial.println("2. Open your web browser"); Serial.println("3. Navigate to the ESP32 S3 Uno's IP address"); Serial.println("4. Click on 'Web Plotter' to view real-time data"); Serial.println("\nGenerating simulated sensor data..."); } void loop() { // Handle web server and WebSocket connections webAppsServer.loop(); // Send sensor data at regular intervals if (millis() - lastDataTime >= DATA_INTERVAL) { lastDataTime = millis(); sendSensorData(); timeCounter += DATA_INTERVAL / 1000.0; // Convert to seconds } } void sendSensorData() { // Generate simulated sensor data // In a real application, replace these with actual sensor readings // Simulated temperature sensor (sine wave with noise) float temperature = 25.0 + 5.0 * sin(timeCounter * 0.5) + random(-100, 100) / 100.0; // Simulated humidity sensor (cosine wave) float humidity = 50.0 + 20.0 * cos(timeCounter * 0.3); // Simulated light sensor (triangle wave) float light = 512.0 + 300.0 * (2.0 * abs(fmod(timeCounter * 0.2, 2.0) - 1.0) - 1.0); // Analog pin reading: A0 on the ESP32 S3 Uno = GPIO2 (12-bit, 0-4095) float analogValue = analogRead(2); // Send data using different methods: // Method 1: Send individual values (uncomment to use) // webPlotterPage.sendPlotData(temperature); // Method 2: Send multiple values at once webPlotterPage.sendPlotData(temperature, humidity, light / 10.0, analogValue / 100.0); // Method 3: Send array of values (alternative approach) // float values[] = {temperature, humidity, light / 10.0, analogValue / 100.0}; // webPlotterPage.sendPlotData(values, 4); // Method 4: Send raw data string (for custom formatting) // String dataLine = String(temperature, 2) + " " + String(humidity, 1) + " " + String(light / 10.0, 1); // webPlotterPage.sendPlotData(dataLine); // Print to Serial Monitor in Serial Plotter compatible format // Format: Temperature Humidity Light Analog (tab-separated for Serial Plotter) Serial.print(temperature, 1); Serial.print("\t"); Serial.print(humidity, 1); Serial.print("\t"); Serial.print(light / 10.0, 1); Serial.print("\t"); Serial.println(analogValue / 100.0, 2); }

The sketch creates a home page and a Web Plotter page, then joins your WiFi network. Every second it builds four values (a simulated temperature, humidity and light level, plus the real reading of A0) and sends them to the chart with sendPlotData(). It also prints the same values to the Serial Monitor.

The line analogSetAttenuation(ADC_11db); in setup() matters for the A0 reading. By default the ESP32 S3 Uno ADC can only measure a small voltage. With 11 dB attenuation, the analog pin reads the full range from 0V up to about 3.3V. Without it, the reading hits 4095 too early and the values look wrong.

  1. Set your WiFi: put your network name and password in these two lines:
const char WIFI_SSID[] = "YOUR_WIFI_SSID"; const char WIFI_PASSWORD[] = "YOUR_WIFI_PASSWORD";
  1. Upload: click the Upload button to send the code to the ESP32 S3 Uno.
  2. Open the Serial Monitor at 9600 baud. You should see something like this:
∞
Newbiely | Arduino IDE 2.3.8
──
☐
✕
File
Edit
Sketch
Tools
Help
ESP32S3 Dev Module
Newbiely.ino
···
8 Serial.println("Hello World!");
Output
Serial Monitor
Message (Enter to send message to 'ESP32S3 Dev Module' on 'COM15')
New Line
9600 baud
DIYables ESP32 WebApp - Web Plotter Example INFO: Added app / INFO: Added app /web-plotter DIYables WebApp Library Platform: ESP32 Network connected! IP address: 192.168.0.2 HTTP server started on port 80 Configuring WebSocket server callbacks... WebSocket server started on port 81 WebSocket URL: ws://192.168.0.2:81 WebSocket server started on port 81 ========================================== DIYables WebApp Ready! ========================================== 📱 Web Interface: http://192.168.0.2 🔗 WebSocket: ws://192.168.0.2:81 📋 Available Applications: 🏠 Home Page: http://192.168.0.2/ 📊 Web Plotter: http://192.168.0.2/web-plotter ==========================================
Ln 11, Col 1
ESP32S3 Dev Module on COM15
2
  1. No output? Press the RESET button on the ESP32 S3 Uno and watch the Serial Monitor again.
  2. Open the home page: type the IP address from the Serial Monitor into the address bar of a browser on your phone or PC, for example http://192.168.0.2. You will see the home page:
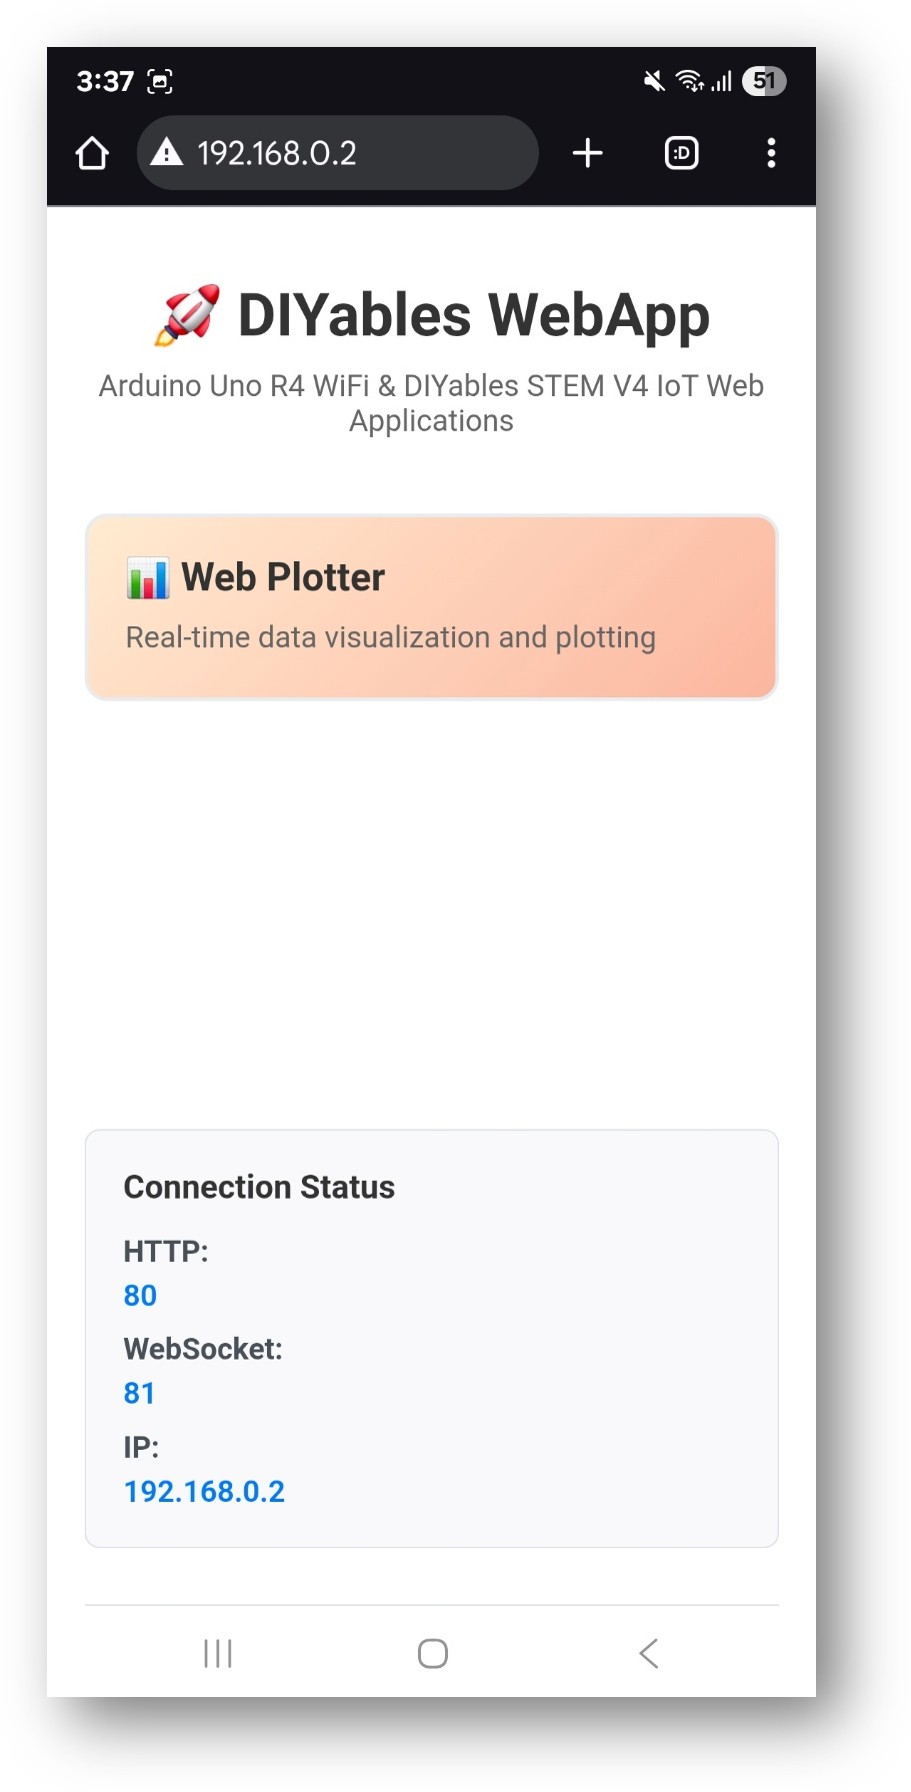
ESP32 S3 Uno DIYables WebApp Home page with Web Plotter app
  1. Open the plotter: click the Web Plotter link. The Web Plotter app looks like this:
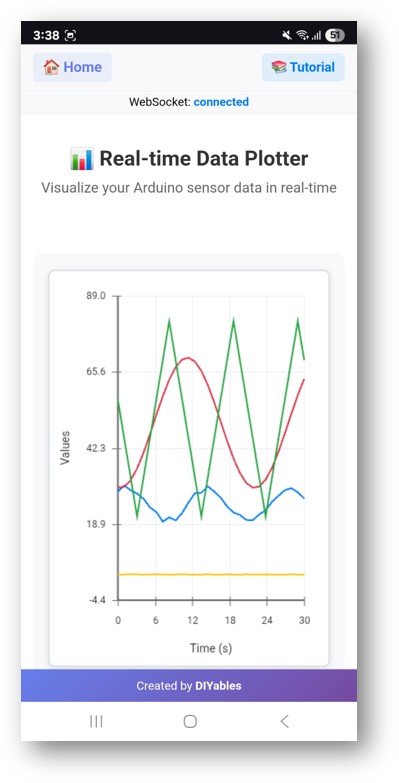
ESP32 S3 Uno DIYables WebApp Web Plotter app
  1. Watch the data: the ESP32 S3 Uno sends simulated sensor data, and you see several colored lines move across the chart in real time.
  2. Tip: you can skip the home page and open the plotter directly by adding /web-plotter to the IP address, for example http://192.168.0.2/web-plotter. Bookmark it on your phone.

Creative Customization - Visualize Your Data Creatively

The simulated data is only there so you can test the page. The real value comes when you plot your own sensors. The snippets below show common patterns. On the ESP32 S3 Uno, write the GPIO number in analogRead(): A0 = GPIO2, A1 = GPIO1, A2 = GPIO7. The ADC gives 0 to 4095 (12-bit) and the reference voltage is 3.3V. Keep analogSetAttenuation(ADC_11db); in setup() whenever you read an analog sensor.

Data Source Configuration

Swap the fake values for real readings. You can send one value, several values, or a whole array.

Method 1: Single Sensor Reading

This example reads an LM35 temperature sensor on A0. The LM35 gives 10mV per °C, so the math turns the 12-bit reading into a voltage and then into degrees.

void sendTemperatureData() { float temperature = analogRead(2) * (3.3 / 4095.0) * 100; // LM35 temperature sensor on A0 (GPIO2) webPlotterPage.sendPlotData(temperature); }

Method 2: Multiple Sensors

Pass several values in one call, and each one becomes its own line on the chart.

void sendMultipleSensors() { float temperature = readTemperature(); float humidity = readHumidity(); float light = analogRead(1) / 10.0; // A1 (GPIO1) float pressure = readPressure(); webPlotterPage.sendPlotData(temperature, humidity, light, pressure); }

Method 3: Array of Values

When you have many values, put them in an array and pass the array with its length.

void sendSensorArray() { float sensors[6] = { analogRead(2) / 10.0, // Sensor 1 on A0 (GPIO2) analogRead(1) / 10.0, // Sensor 2 on A1 (GPIO1) analogRead(7) / 10.0, // Sensor 3 on A2 (GPIO7) digitalRead(18) * 50, // Digital state on D2 (GPIO18) millis() / 1000.0, // Time counter random(0, 100) // Random data }; webPlotterPage.sendPlotData(sensors, 6); }

Plot Customization

A clear title and good axis labels make the chart easy to read, especially when you show it to someone else.

Custom Plot Appearance

Use a fixed Y-axis range when you know the limits of your data. More samples show a longer history.

void setupCustomPlot() { webPlotterPage.setPlotTitle("Environmental Monitoring Station"); webPlotterPage.setAxisLabels("Time (minutes)", "Sensor Readings"); webPlotterPage.setYAxisRange(0, 100); // Fixed Y-axis range webPlotterPage.setMaxSamples(100); // Show more data points }

Dynamic Configuration

Turn on auto scaling when the range changes a lot. The onPlotterDataRequest() callback runs when a browser connects, so you can send a first batch of data right away.

void setupDynamicPlot() { webPlotterPage.setPlotTitle("Smart Garden Monitor"); webPlotterPage.setAxisLabels("Sample #", "Values"); webPlotterPage.enableAutoScale(true); // Auto-adjust Y-axis // Configure callbacks for interactive features webPlotterPage.onPlotterDataRequest([]() { Serial.println("Client connected - sending initial data"); sendInitialDataBurst(); }); }

Advanced Data Processing

Raw sensor data is often noisy. A little processing on the ESP32 S3 Uno makes the chart much easier to read.

Moving Average Filter

This filter keeps the last 10 readings and returns their average. The sketch plots the raw value and the smooth value side by side, so you can see the effect.

float movingAverage(float newValue) { static float readings[10]; static int index = 0; static float total = 0; total -= readings[index]; readings[index] = newValue; total += readings[index]; index = (index + 1) % 10; return total / 10.0; } void sendFilteredData() { float rawValue = analogRead(2); // A0 (GPIO2) float filteredValue = movingAverage(rawValue); webPlotterPage.sendPlotData(rawValue / 10.0, filteredValue / 10.0); }

Data Logging with Timestamps

Here the time in seconds is sent as its own series next to the sensor value. The same data also goes to the Serial Monitor for debugging.

void sendTimestampedData() { unsigned long currentTime = millis() / 1000; float sensorValue = analogRead(2) / 10.0; // A0 (GPIO2) // Send time and value as separate data series webPlotterPage.sendPlotData(currentTime, sensorValue); // Also log to Serial for debugging Serial.print("Time: "); Serial.print(currentTime); Serial.print("s, Value: "); Serial.println(sensorValue); }

Integration Examples

These examples show how the plotter fits into real projects. Change the pins and the math to match your parts.

Environmental Monitoring

A DHT22 sensor on D2 (GPIO18) gives temperature and humidity, and a light sensor on A0 (GPIO2) adds a third line. The code only plots when the DHT reading is valid.

#include <DHT.h> #define DHT_PIN 18 // D2 (GPIO18) #define DHT_TYPE DHT22 DHT dht(DHT_PIN, DHT_TYPE); void sendEnvironmentalData() { float temperature = dht.readTemperature(); float humidity = dht.readHumidity(); float lightLevel = analogRead(2) / 10.0; // A0 (GPIO2) if (!isnan(temperature) && !isnan(humidity)) { webPlotterPage.sendPlotData(temperature, humidity, lightLevel); Serial.print("T: "); Serial.print(temperature); Serial.print("°C, H: "); Serial.print(humidity); Serial.print("%, Light: "); Serial.println(lightLevel); } }

Motor Control Feedback

This snippet plots motor speed, current and position. Note the math uses 4095 and 3.3V, because the ESP32 S3 Uno ADC is 12-bit and runs at 3.3V.

void sendMotorData() { int motorSpeed = analogRead(2); // Speed potentiometer on A0 (GPIO2) int currentDraw = analogRead(1); // Current sensor on A1 (GPIO1) int motorPosition = digitalRead(18); // Position sensor on D2 (GPIO18) float speedPercent = (motorSpeed / 4095.0) * 100; float currentAmps = (currentDraw / 4095.0) * 3.3; float positionDegrees = motorPosition * 90; webPlotterPage.sendPlotData(speedPercent, currentAmps, positionDegrees); }

PID Controller Visualization

Tuning a PID loop is much easier when you can see it. This code plots the setpoint, the input, the error and the output on one chart.

float setpoint = 50.0; float kp = 1.0, ki = 0.1, kd = 0.01; float integral = 0, previousError = 0; void sendPIDData() { float input = analogRead(2) / 10.0; // A0 (GPIO2) float error = setpoint - input; integral += error; float derivative = error - previousError; float output = (kp * error) + (ki * integral) + (kd * derivative); previousError = error; // Plot setpoint, input, error, and output webPlotterPage.sendPlotData(setpoint, input, error, output); }

Performance Optimization

Sending data too often can slow down the browser and fill the WiFi link. These two patterns keep things smooth.

Efficient Data Transmission

Send data at a fixed interval with millis(), not on every loop. Here the interval is 100ms.

unsigned long lastPlotUpdate = 0; const unsigned long PLOT_INTERVAL = 100; // Update every 100ms void efficientDataSending() { if (millis() - lastPlotUpdate >= PLOT_INTERVAL) { lastPlotUpdate = millis(); // Only send data at defined intervals float value1 = analogRead(2) / 10.0; // A0 (GPIO2) float value2 = analogRead(1) / 10.0; // A1 (GPIO1) webPlotterPage.sendPlotData(value1, value2); } }

Conditional Data Sending

Send a new point only when the value changes by more than a threshold. This saves bandwidth when the sensor is stable.

float lastSentValue = 0; const float CHANGE_THRESHOLD = 5.0; void sendOnChange() { float currentValue = analogRead(2) / 10.0; // A0 (GPIO2) // Only send if value changed significantly if (abs(currentValue - lastSentValue) > CHANGE_THRESHOLD) { webPlotterPage.sendPlotData(currentValue); lastSentValue = currentValue; } }

Project Ideas

A live chart is useful in many kinds of projects. Here are some ideas to get you started with the ESP32 S3 Uno and the Web Plotter.

Scientific Applications

Build a data logger that records temperature, humidity and pressure over time. You can also study vibration with an accelerometer, track the pH of water in an aquaponics system, or compare the voltage and current of a solar panel with the amount of sunlight.

Educational Projects

Plot the swing of a pendulum or the bounce of a spring in a physics class. In chemistry, watch the temperature of a reaction. In biology, follow the sensors around a growing plant. In math, draw functions and the output of your own algorithms.

Home Automation

Watch your power use over a day, follow soil moisture and light in the garden, check temperature and humidity trends for heating and cooling, or plot the activity of a motion sensor.

Robotics and Control

Plot the position and heading of a robot, the speed and torque of a motor, the result of combining several sensors, or the path your robot plans to follow.

Common Problems and Debug Tips

Most plotter problems come from WiFi, the WebSocket link or noisy data. Check the points below before you change your code.

Common Issues

No data appears on the plot

Check that the ESP32 S3 Uno is connected to WiFi and look for errors in the Serial Monitor. Open the browser console to see if the WebSocket link is up. Make sure your code calls sendPlotData() on a regular basis.

The plot is jumpy or erratic

Add a moving average filter or send data less often. Check the sensor wires for loose contacts, and make sure the power supply is stable. A floating analog pin with nothing connected also gives random values.

The browser becomes slow

Lower the number of samples with setMaxSamples(), send data less often, close other browser tabs, and turn on hardware acceleration in the browser.

The WebSocket connection drops

Check the WiFi signal strength and move the board closer to the router. Make sure your router or firewall does not block port 81. Add reconnection logic to your own code if needed, and keep an eye on the free memory of the ESP32 S3 Uno.

Debug Tips

Enable Detailed Logging

Print some status data to the Serial Monitor. On the ESP32 S3 Uno, ESP.getFreeHeap() returns the free RAM in bytes.

void debugPlotterData() { Serial.println("=== Plotter Debug Info ==="); Serial.print("Free RAM: "); Serial.println(ESP.getFreeHeap()); Serial.print("Connected clients: "); Serial.println(server.getConnectedClients()); Serial.print("Data rate: "); Serial.println("Every " + String(DATA_INTERVAL) + "ms"); Serial.println("========================"); }

Test Data Generation

If you are not sure whether the problem is your sensor or the plotter, send a known pattern. A clean sine, cosine and ramp on the chart proves that the web part works.

void generateTestPattern() { static float phase = 0; float sine = sin(phase) * 50 + 50; float cosine = cos(phase) * 30 + 70; float triangle = (phase / PI) * 25 + 25; webPlotterPage.sendPlotData(sine, cosine, triangle); phase += 0.1; if (phase > 2 * PI) phase = 0; }

Advanced Features

When the basic plot works, you can go further: format the data yourself, combine the plotter with other apps, or control hardware while you watch the result.

Custom Data Formatting

You can also send one text line with values separated by tabs. This gives you full control over the number of decimals.

void sendFormattedData() { float temp = 25.5; float humidity = 60.3; // Create custom formatted data string String dataLine = String(temp, 1) + "\t" + String(humidity, 1); webPlotterPage.sendPlotData(dataLine); }

Integration with Other WebApps

The plotter can run next to other apps of the same library. In this example a slider changes what gets plotted.

void setupMultipleApps() { // Add multiple web applications server.addApp(new DIYablesHomePage()); server.addApp(new DIYablesWebDigitalPinsPage()); server.addApp(new DIYablesWebSliderPage()); server.addApp(&webPlotterPage); server.addApp(new DIYablesNotFoundPage()); // Configure interactions between apps webSliderPage.onSliderValueFromWeb([](int slider1, int slider2) { // Use slider values to control what gets plotted float scaleFactor = slider1 / 255.0; // ... plotting logic }); }

Real-time Control with Plotting

Read a target value, drive a PWM output, read the feedback and plot target against actual. The PWM output is on D9 (GPIO46). Because the ADC gives 0 to 4095 and analogWrite() takes 0 to 255, the code divides by 16.

void controlAndPlot() { // Read control inputs int targetSpeed = analogRead(2); // A0 (GPIO2) // Control hardware analogWrite(46, targetSpeed / 16); // PWM output on D9 (GPIO46) // Read feedback int actualSpeed = analogRead(1); // A1 (GPIO1) int motorCurrent = analogRead(7); // A2 (GPIO7) // Plot target vs actual webPlotterPage.sendPlotData( targetSpeed / 16.0, // Target speed actualSpeed / 16.0, // Actual speed motorCurrent / 10.0 // Current draw ); }

WARNING

D9 (GPIO46) is a boot strapping pin on the ESP32 S3 Uno. The board reads it at startup to choose the boot mode. If your motor driver pulls this pin high or low during reset, the board may not boot or may fail to upload code. If that happens, unplug the wire while you upload, or move the PWM output to another pin.

ESP32 S3 Uno Web Plotter with DHT11 Sensor

Now plot real data from a DHT11 temperature and humidity sensor. The DHT11 works at 3.3V, so you can power it straight from the ESP32 S3 Uno. Connect its DATA pin to D2 (GPIO18).

DHT11 Pin ESP32 S3 Uno Pin
VCC 3.3V
GND GND
DATA D2 (GPIO18)

Install the "DHT sensor library" by Adafruit from the Library Manager, then use the complete code below. It sets DHT_PIN to 18, starts the sensor in setup(), and has a sendEnvironmentalData() function that sends temperature and humidity to the plotter.

#include <DIYables_ESP32_Platform.h> #include <DIYablesWebApps.h> #include <DHT.h> #define DHT_PIN 18 // ESP32 S3 Uno pin D2 (GPIO18) connected to the DHT11 DATA pin #define DHT_TYPE DHT11 DHT dht(DHT_PIN, DHT_TYPE); // WiFi credentials - UPDATE THESE WITH YOUR NETWORK const char WIFI_SSID[] = "YOUR_WIFI_SSID"; const char WIFI_PASSWORD[] = "YOUR_WIFI_PASSWORD"; // Create WebApp server and page instances ESP32ServerFactory serverFactory; DIYablesWebAppServer webAppsServer(serverFactory, 80, 81); DIYablesHomePage homePage; DIYablesWebPlotterPage webPlotterPage; // Simulation variables unsigned long lastDataTime = 0; const unsigned long DATA_INTERVAL = 1000; // Send data every 1000ms float timeCounter = 0; void setup() { Serial.begin(9600); // set the ADC attenuation to 11 dB (up to ~3.3V input) analogSetAttenuation(ADC_11db); delay(1000); // TODO: Initialize your hardware pins and sensors here dht.begin(); Serial.println("DIYables ESP32 WebApp - Web Plotter Example"); // Add home and web plotter pages webAppsServer.addApp(&homePage); webAppsServer.addApp(&webPlotterPage); // Optional: Add 404 page for better user experience webAppsServer.setNotFoundPage(DIYablesNotFoundPage()); // Configure the plotter webPlotterPage.setPlotTitle("Real-time Data Plotter"); webPlotterPage.setAxisLabels("Time (s)", "Values"); webPlotterPage.enableAutoScale(true); webPlotterPage.setMaxSamples(50); // Start the WebApp server if (!webAppsServer.begin(WIFI_SSID, WIFI_PASSWORD)) { while (1) { Serial.println("Failed to start WebApp server!"); delay(1000); } } // Set up callbacks webPlotterPage.onPlotterDataRequest([]() { Serial.println("Web client requested data"); sendSensorData(); }); Serial.println("\nWebPlotter is ready!"); Serial.println("Usage Instructions:"); Serial.println("1. Connect to the WiFi network"); Serial.println("2. Open your web browser"); Serial.println("3. Navigate to the ESP32 S3 Uno's IP address"); Serial.println("4. Click on 'Web Plotter' to view real-time data"); Serial.println("\nGenerating simulated sensor data..."); } void loop() { // Handle web server and WebSocket connections webAppsServer.loop(); // Send sensor data at regular intervals if (millis() - lastDataTime >= DATA_INTERVAL) { lastDataTime = millis(); sendSensorData(); timeCounter += DATA_INTERVAL / 1000.0; // Convert to seconds } delay(10000); } void sendSensorData() { // Generate simulated sensor data // In a real application, replace these with actual sensor readings // Simulated temperature sensor (sine wave with noise) float temperature = 25.0 + 5.0 * sin(timeCounter * 0.5) + random(-100, 100) / 100.0; // Simulated humidity sensor (cosine wave) float humidity = 50.0 + 20.0 * cos(timeCounter * 0.3); // Simulated light sensor (triangle wave) float light = 512.0 + 300.0 * (2.0 * abs(fmod(timeCounter * 0.2, 2.0) - 1.0) - 1.0); // Analog pin reading: A0 on the ESP32 S3 Uno = GPIO2 (12-bit, 0-4095) float analogValue = analogRead(2); // Send data using different methods: // Method 1: Send individual values (uncomment to use) // webPlotterPage.sendPlotData(temperature); // Method 2: Send multiple values at once webPlotterPage.sendPlotData(temperature, humidity, light / 10.0, analogValue / 100.0); // Method 3: Send array of values (alternative approach) // float values[] = {temperature, humidity, light / 10.0, analogValue / 100.0}; // webPlotterPage.sendPlotData(values, 4); // Method 4: Send raw data string (for custom formatting) // String dataLine = String(temperature, 2) + " " + String(humidity, 1) + " " + String(light / 10.0, 1); // webPlotterPage.sendPlotData(dataLine); // Print to Serial Monitor in Serial Plotter compatible format // Format: Temperature Humidity Light Analog (tab-separated for Serial Plotter) Serial.print(temperature, 1); Serial.print("\t"); Serial.print(humidity, 1); Serial.print("\t"); Serial.print(light / 10.0, 1); Serial.print("\t"); Serial.println(analogValue / 100.0, 2); } void sendEnvironmentalData() { float temperature = dht.readTemperature(); float humidity = dht.readHumidity(); if (!isnan(temperature) && !isnan(humidity)) { webPlotterPage.sendPlotData(temperature, humidity); Serial.print("T: "); Serial.print(temperature); Serial.print("°C, H: "); Serial.println(humidity); } }

Watch the video below to see this ESP32 S3 Uno project step by step.

Next Steps

When the plotter works well, try the other apps of the same library:

  1. Multiple Web Apps – combine the plot with control pages
  2. WebMonitor – add a Serial Monitor in the browser next to your plot
  3. Build your own special plotting tool for your project
  4. Add simple statistics, like minimum, maximum and average, to the plotted data

Support

If you get stuck, read the DIYables ESP32 WebApps library reference and the other ESP32 S3 Uno WebApps tutorials on this site. The browser developer console helps you debug the WebSocket link, and the Arduino and Espressif community forums are good places to ask.

FAQ

Can I use the Web Plotter instead of the Arduino IDE Serial Plotter?

Yes. The Web Plotter shows the same kind of live chart, but in a web browser over WiFi. You do not need a USB cable once the code runs, and you can open the chart on your phone.

Why does my ESP32 S3 Uno analog value go up to 4095 and not 1023?

The ESP32 S3 Uno ADC is 12-bit, so analogRead() returns 0 to 4095. Boards like the UNO R4 use 10-bit by default and return 0 to 1023. Change any math that uses 1023 to 4095, and use 3.3V instead of 5V for voltage math.

Why does the code call analogSetAttenuation(ADC_11db)?

It sets the ESP32 S3 Uno ADC input range to about 0 to 3.3V, so the full sensor signal maps to 0 to 4095. Without it the range is smaller and the readings hit the top too early. The UNO R4 does not need this line, because it is for ESP32 only. Keep the sensor output at 3.3V or less.

Which pins can I use for analog sensors on the plotter?

Use A0 to A5 on the Uno header, and write the GPIO number in code: A0 = 2, A1 = 1, A2 = 7, A3 = 6, A4 = 5, A5 = 4. Many digital header pins (like D2, D3 and D7) can also read analog values. Remember that the pins are NOT 5V tolerant.

Why can't my ESP32 S3 Uno connect to my WiFi?

The ESP32 S3 Uno supports only 2.4GHz WiFi. If your router uses one name for both bands, try a separate 2.4GHz network. Also check the SSID and password, because they are case sensitive.

What if my project needs more pins than the Uno headers give?

The ESP32 S3 Uno has two extra rows of holes with more GPIOs: GPIO15 and GPIO16 (I/O, PWM, analog), GPIO45 and GPIO35 to GPIO42 (I/O, PWM), and GPIO47/GPIO48 (output only, PWM). Solder pin headers to them and write the GPIO number in your code. For more analog sensors on the plot, use GPIO15 and GPIO16. For digital inputs, use GPIO35 to GPIO42, not GPIO47/48. Be careful with two things. First, GPIO47 and GPIO48 may run at 1.8V instead of 3.3V on some modules (especially ones with "V" in the name, like R8V or R16V), so 3.3V devices can be damaged or act strangely. Second, GPIO0, GPIO3 (D6), GPIO45 and GPIO46 (D9) are boot strapping pins, and a wrong connection can stop the board from booting or uploading code. Use the other extra pins first.

Troubleshooting

Problem Possible Cause Solution
No COM port in Arduino IDE USB driver missing or charge-only cable Install the CP210x or CH340 driver, use a data USB cable, or hold BOOT while pressing RESET
Serial Monitor shows Failed to start WebApp server Wrong SSID or password, or a 5GHz network Check the WiFi details and use a 2.4GHz network
Plot page does not load Wrong IP address or the device is on another network Use the IP from the Serial Monitor and join the same WiFi
Page loads but the chart stays empty WebSocket port 81 is blocked or sendPlotData() is not called Refresh the page, check port 81, and call sendPlotData() at a fixed interval
A0 line is noisy or random Nothing is connected to A0, so the pin floats Connect a sensor to A0 (GPIO2) or ignore that line while testing
Analog values stay at 4095 Missing ADC attenuation or input above 3.3V Keep analogSetAttenuation(ADC_11db) in setup() and keep the signal at 3.3V or less
DHT11 values never appear Wrong data pin, loose wire, or missing library Wire DATA to D2 (GPIO18), use DHT_PIN 18, and install the DHT sensor library
Code does not compile Wrong library or wrong board Install DIYables ESP32 WebApps and choose ESP32S3 Dev Module

※ OUR MESSAGES

  • As freelancers, We are AVAILABLE for HIRE. See how to outsource your project to us
  • Please feel free to share the link of this tutorial. However, Please do not use our content on any other websites. We invested a lot of effort and time to create the content, please respect our work!