DIYables Web Apps Web Analog Gauge
Overview
The WebAnalogGauge example creates a professional circular gauge interface accessible from any web browser. Designed for Arduino Uno R4 WiFi and DIYables STEM V4 IoT educational platform with enhanced sensor monitoring capabilities, built-in analog input features, and seamless integration with measurement educational modules. Perfect for monitoring sensor values, voltage levels, pressure readings, or any analog measurement requiring visual feedback.
Watch this step-by-step video tutorial demonstrating how to use a potentiometer with the Web Analog Gauge app:
Features
- Professional Circular Gauge: Interactive gauge display via web interface
- Configurable Range: Custom minimum and maximum values with units
- Real-time Updates: Live sensor value display with smooth needle animation
- Color-coded Zones: Visual status indication (green, yellow, red zones)
- Precision Control: Configurable decimal precision for displayed values
- WebSocket Communication: Instant updates without page refresh
- Mobile Responsive: Works perfectly on desktop, tablet, and mobile devices
- Automatic Config: Set range once in constructor - no manual config needed
- Platform Extensible: Currently implemented for Arduino Uno R4 WiFi, but can be extended for other hardware platforms. See DIYables_WebApps_ESP32
Hardware Preparation
Or you can buy the following kits:
| 1 | × | DIYables STEM V4 IoT Starter Kit (Arduino included) | |
| 1 | × | DIYables Sensor Kit (18 sensors/displays) |
Additionally, some of these links are for products from our own brand, DIYables .
Setup Instructions
Detailed Instructions
Follow these instructions step by step:
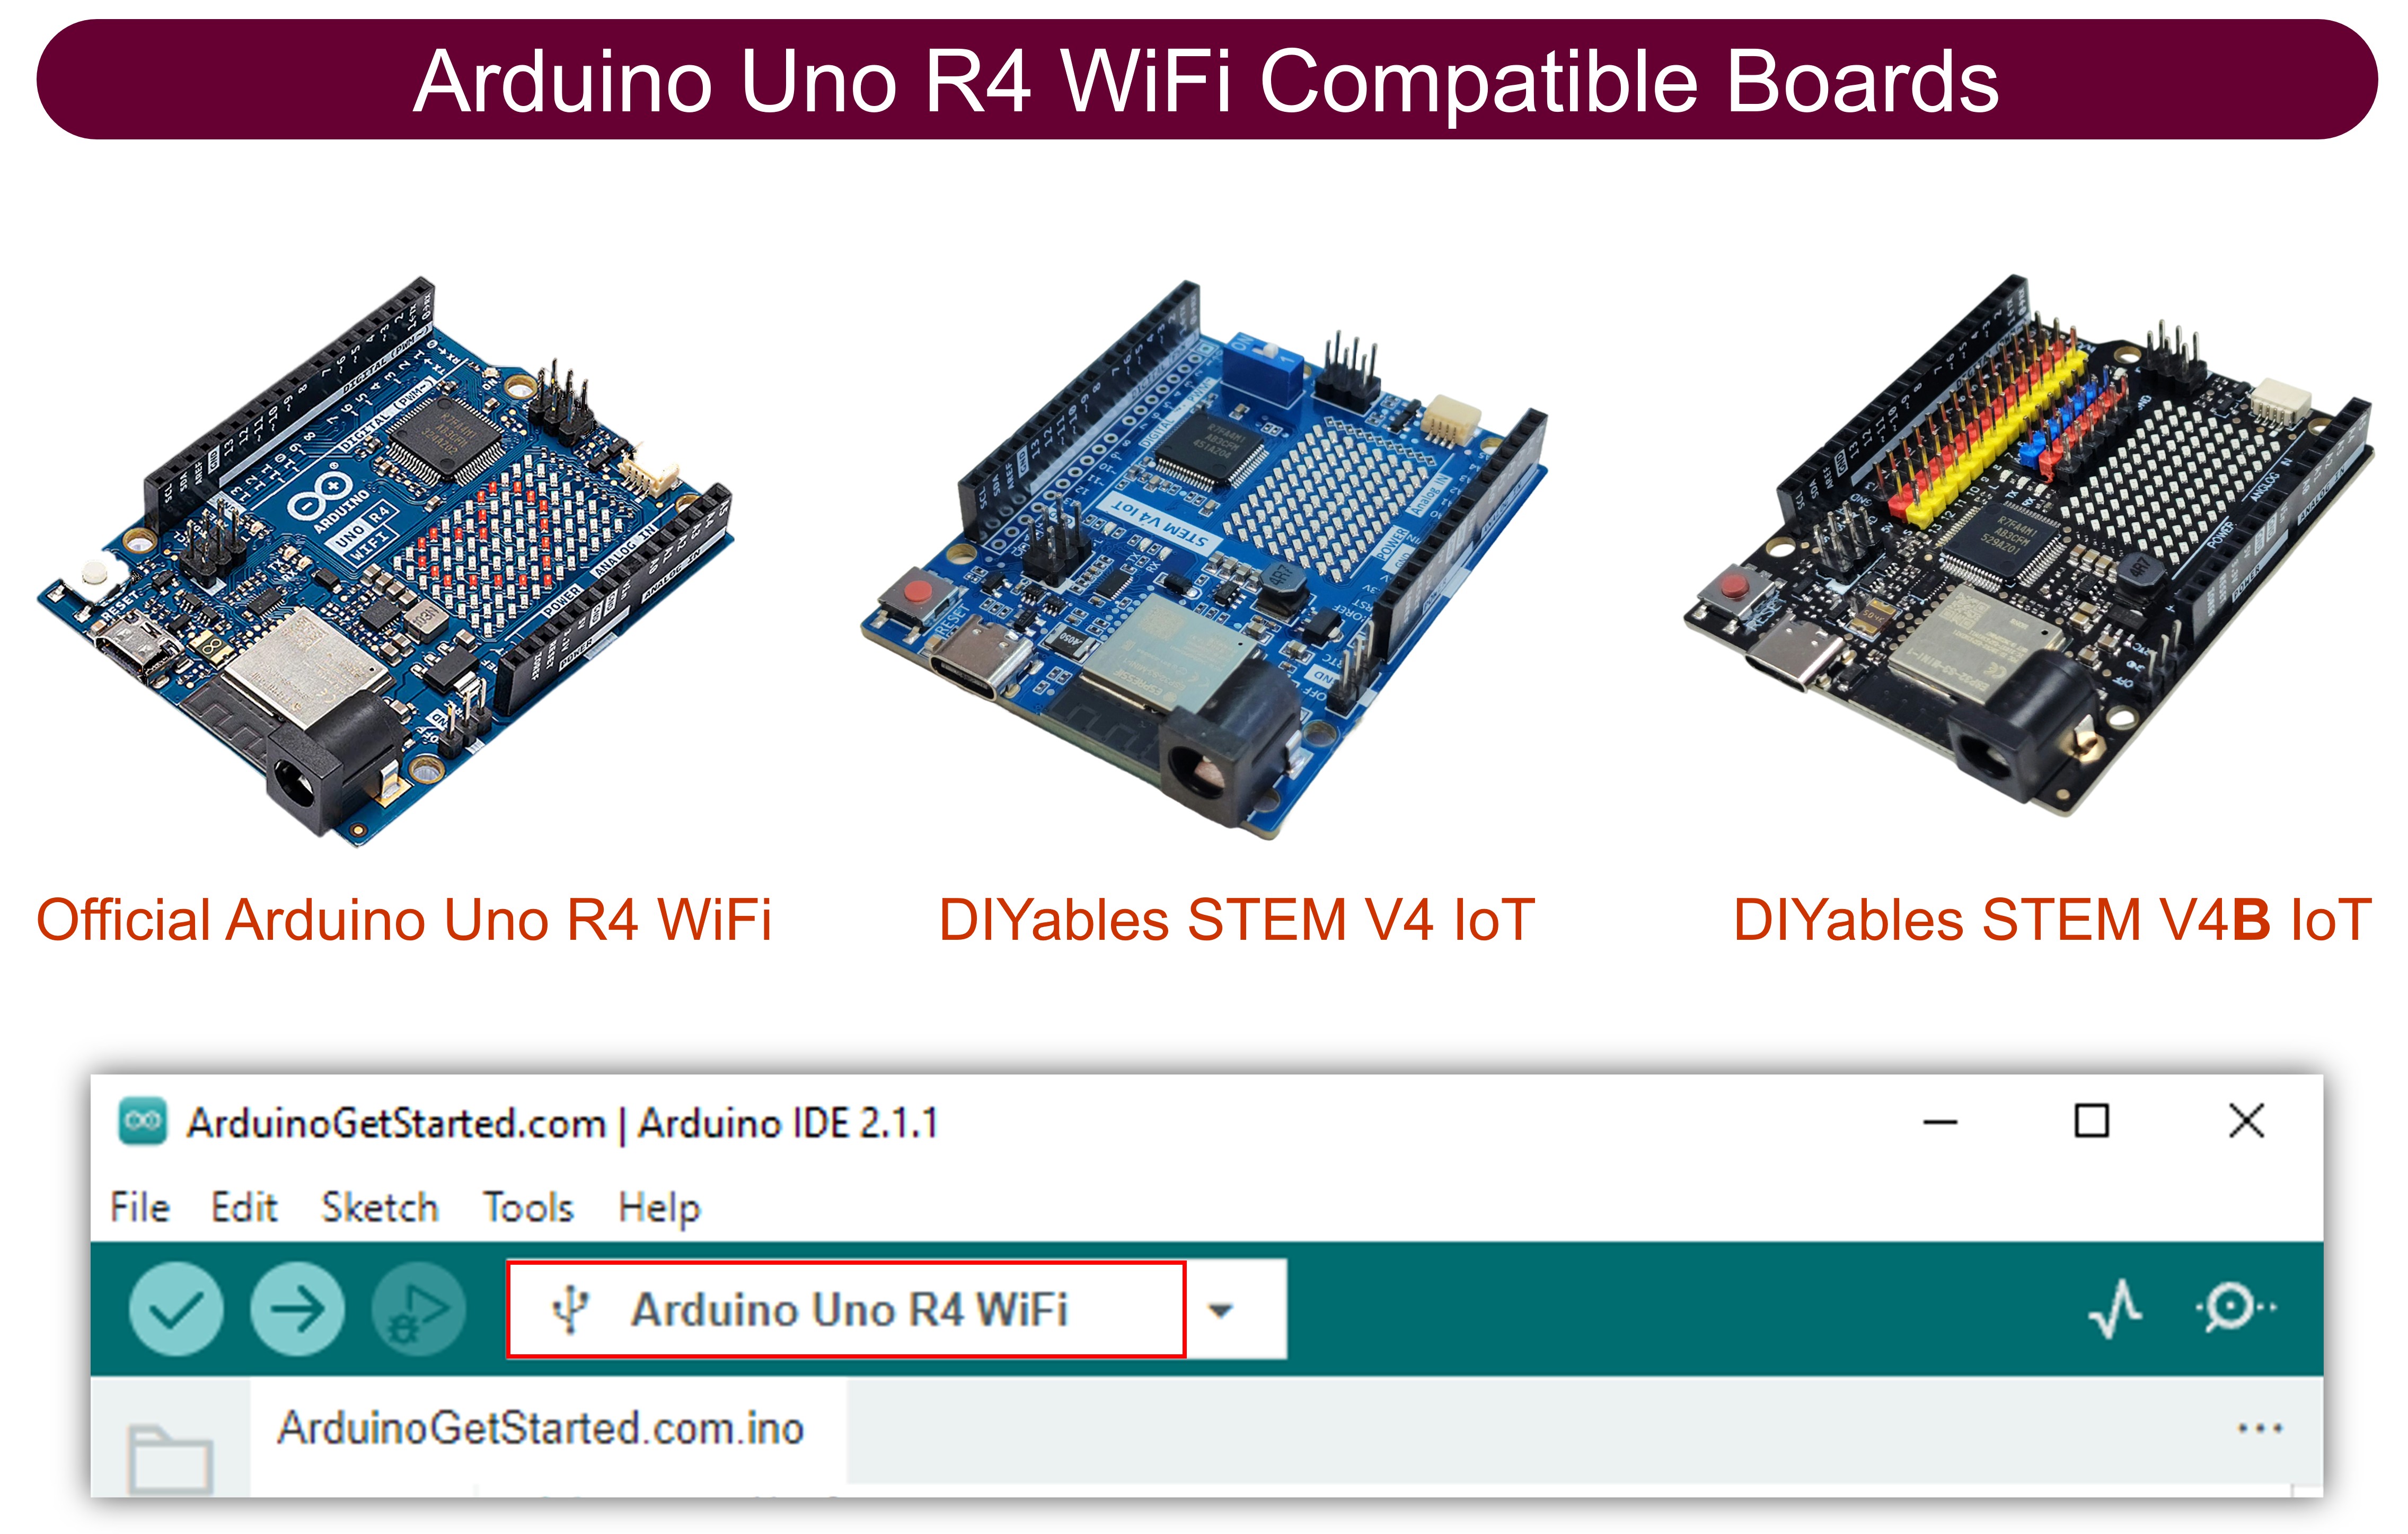
- If this is your first time using the Arduino Uno R4 WiFi/DIYables STEM V4 IoT, refer to the tutorial on setting up the environment for Arduino Uno R4 WiFi/DIYables STEM V4 IoT in the Arduino IDE.
- Connect the Arduino Uno R4/DIYables STEM V4 IoT board to your computer using a USB cable.
- Launch the Arduino IDE on your computer.
- Select the appropriate Arduino Uno R4 board (e.g., Arduino Uno R4 WiFi) and COM port.
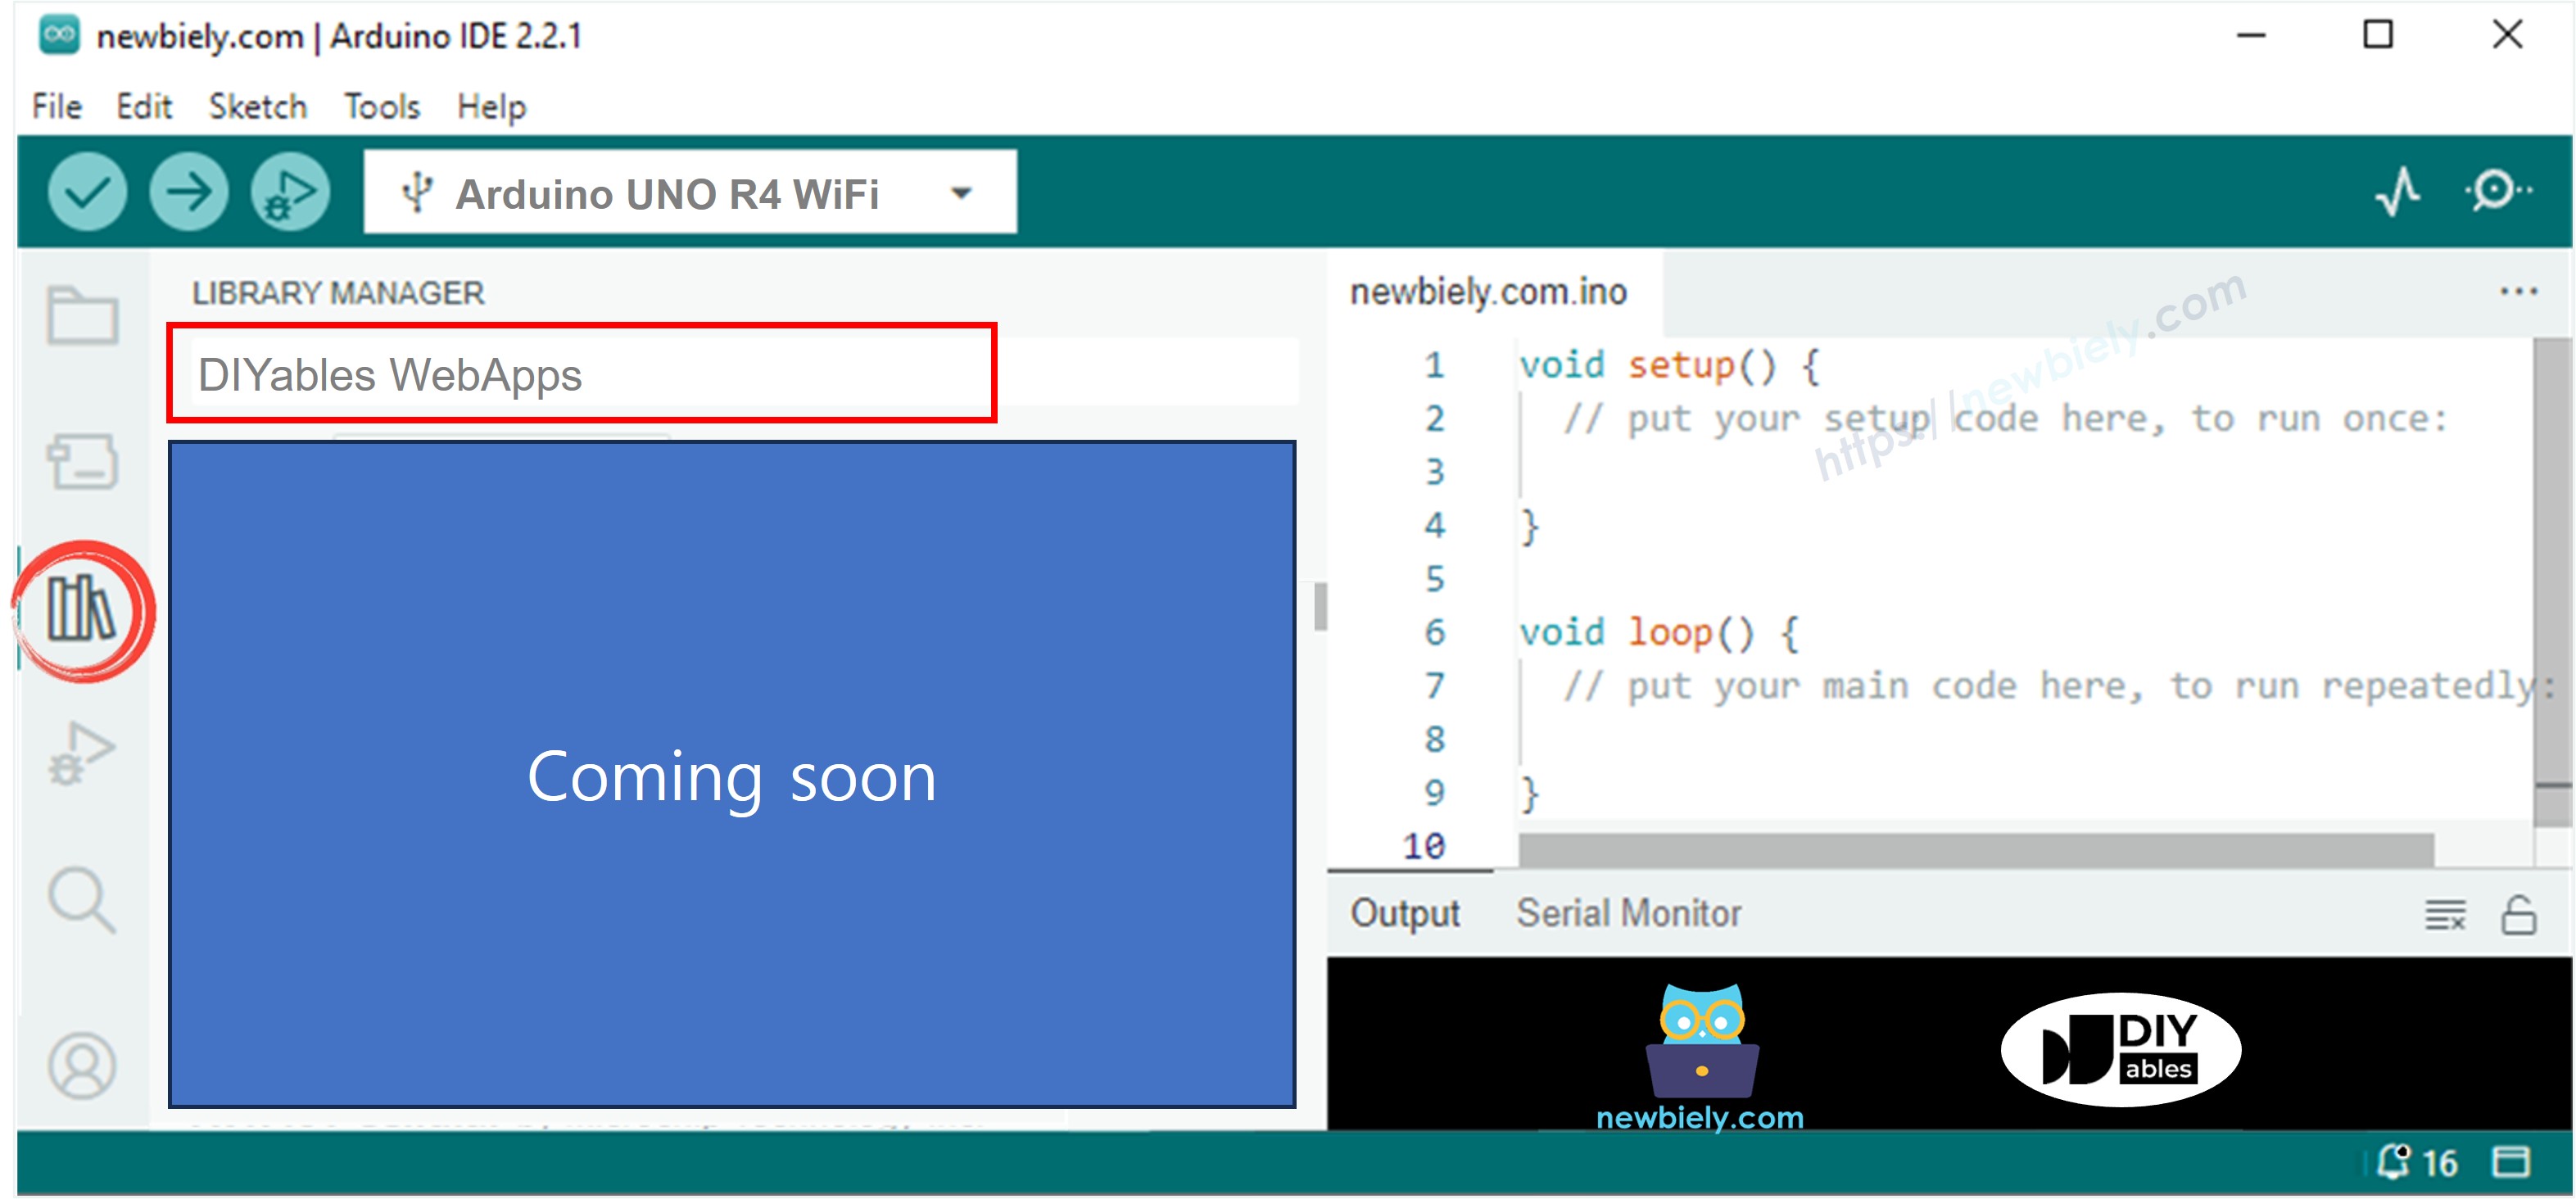
- Navigate to the Libraries icon on the left bar of the Arduino IDE.
- Search "DIYables WebApps", then find the DIYables WebApps library by DIYables
- Click Install button to install the library.
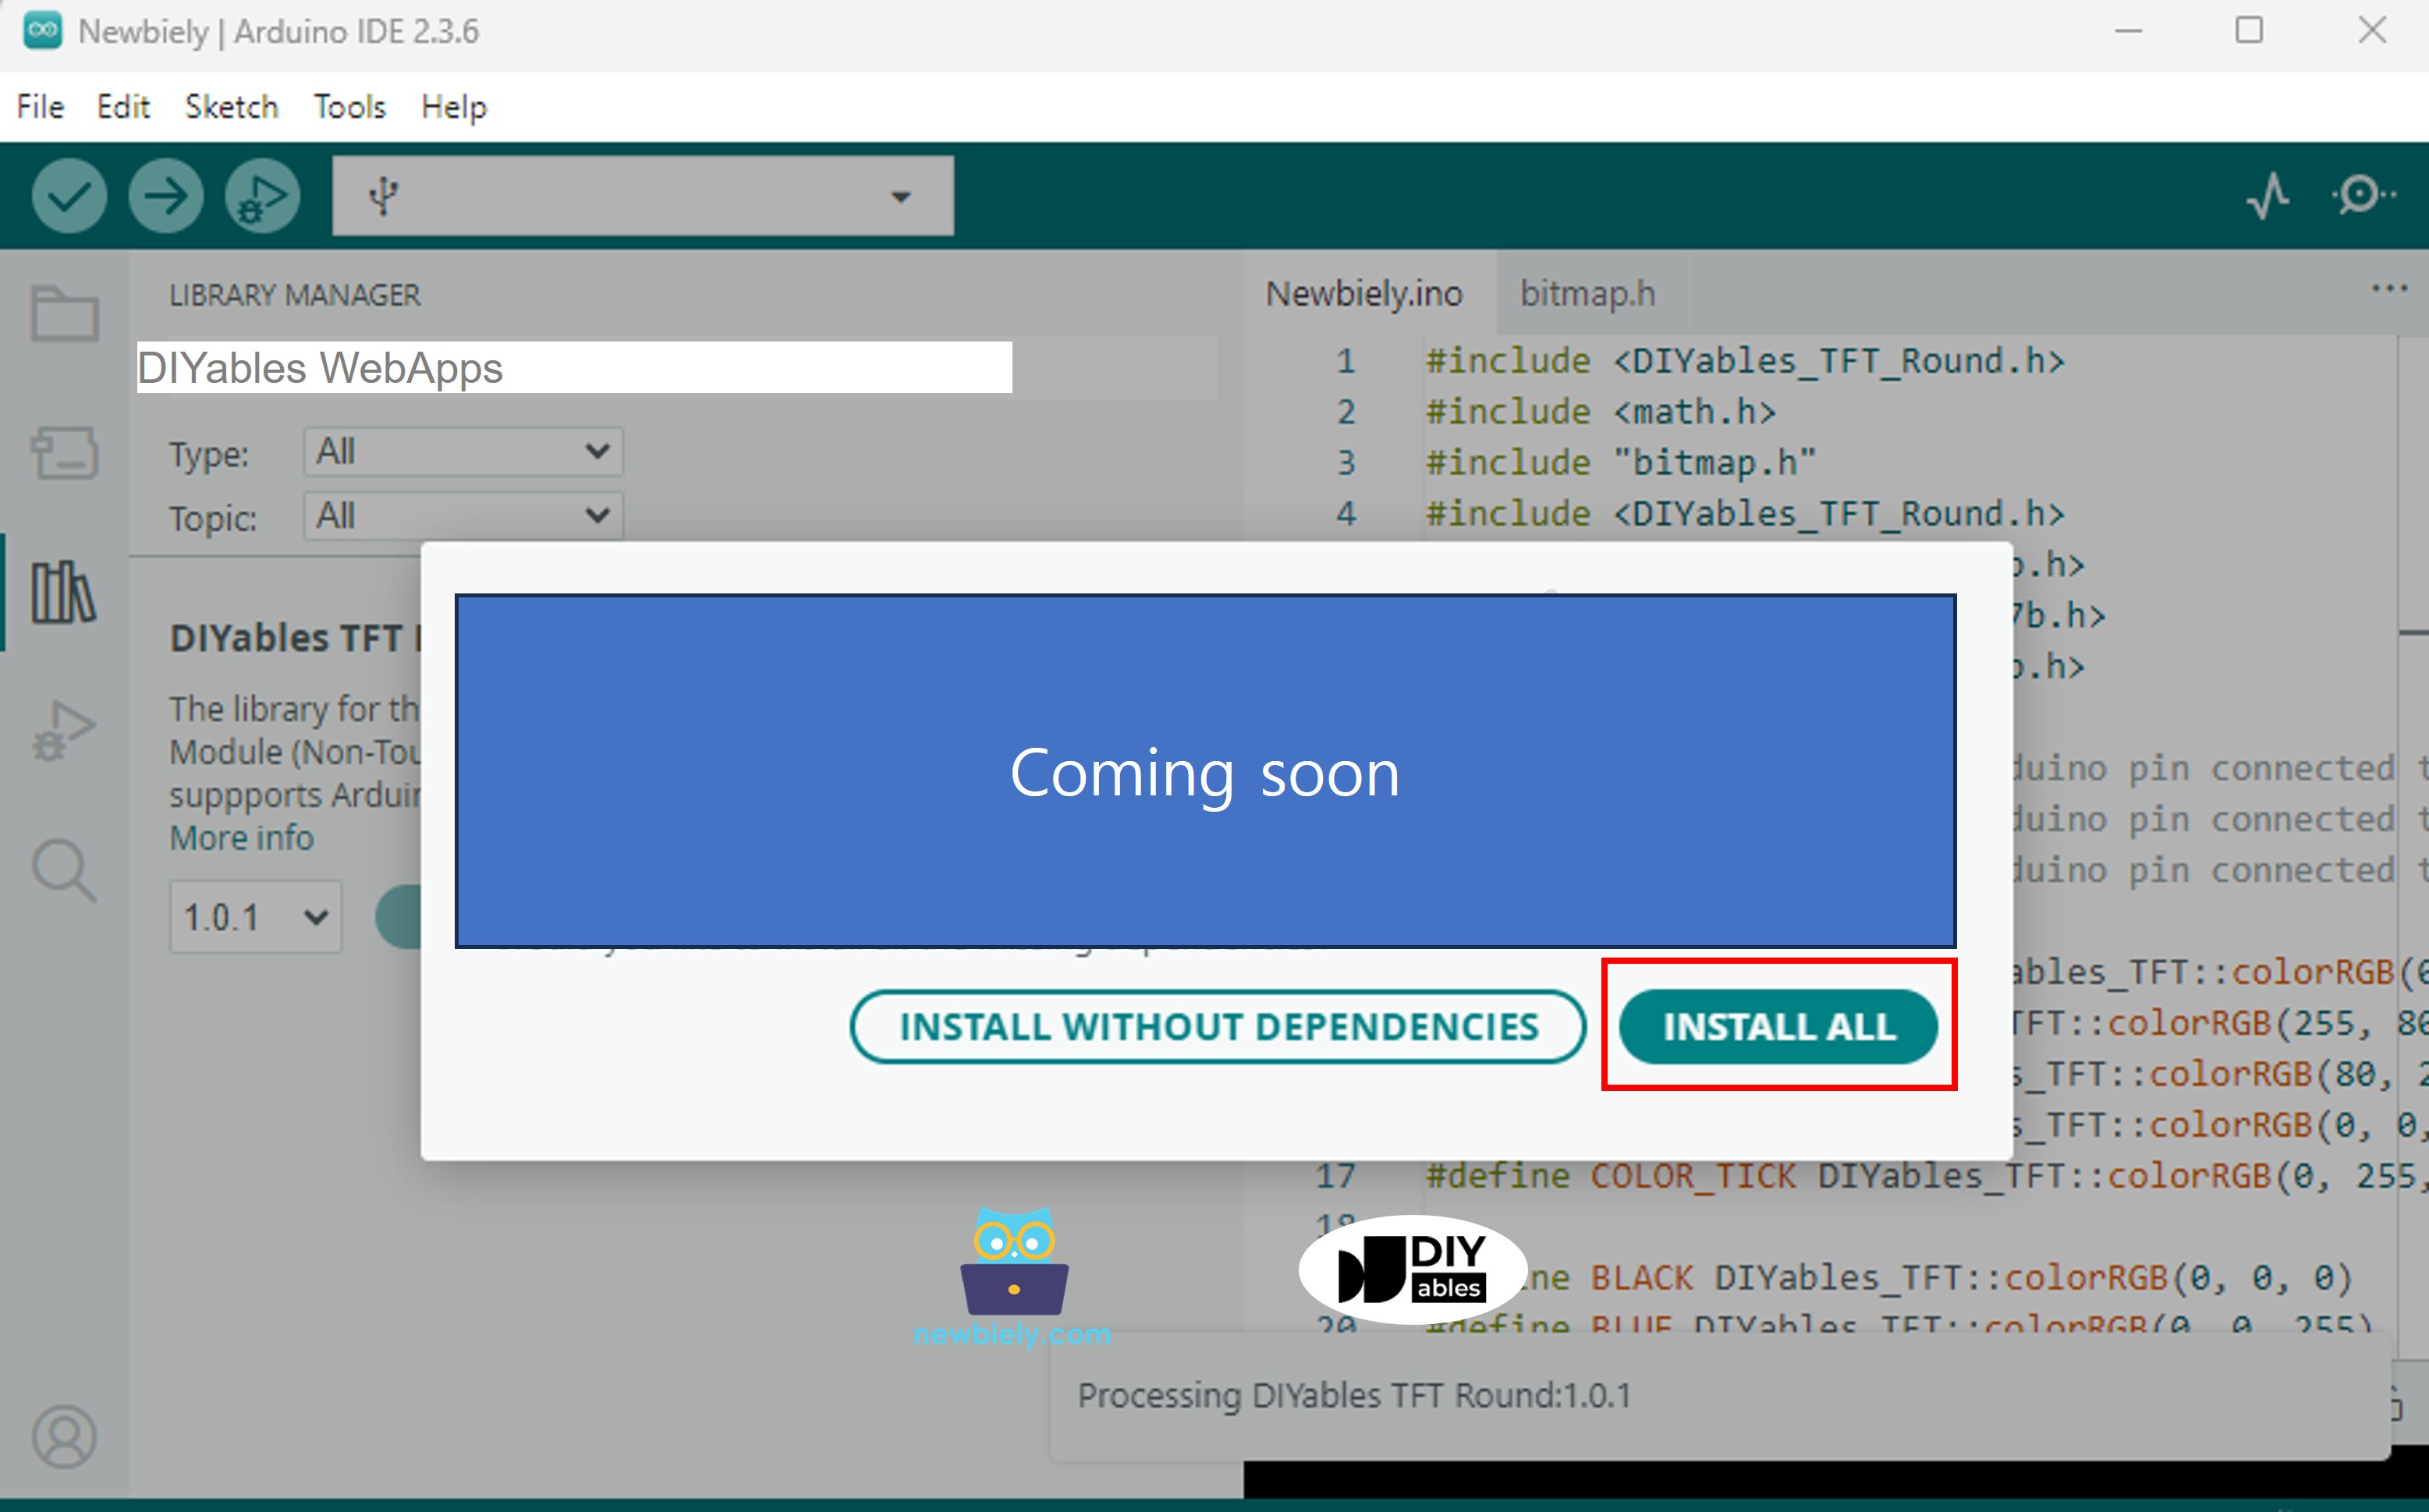
- You will be asked for installing some other library dependencies
- Click Install All button to install all library dependencies.
- On Arduino IDE, Go to File Examples DIYables WebApps WebAnalogGauge example, or copy the above code and paste it to the editor of Arduino IDE
- Configure WiFi credentials in the code by updating these lines:
- Click Upload button on Arduino IDE to upload code to Arduino UNO R4/DIYables STEM V4 IoT
- Open the Serial Monitor
- Check out the result on Serial Monitor. It looks like the below
- Open a web browser on your PC or mobile phone.
- Type the IP address shown in the Serial Monitor to the web browser
- Example: http://192.168.1.100
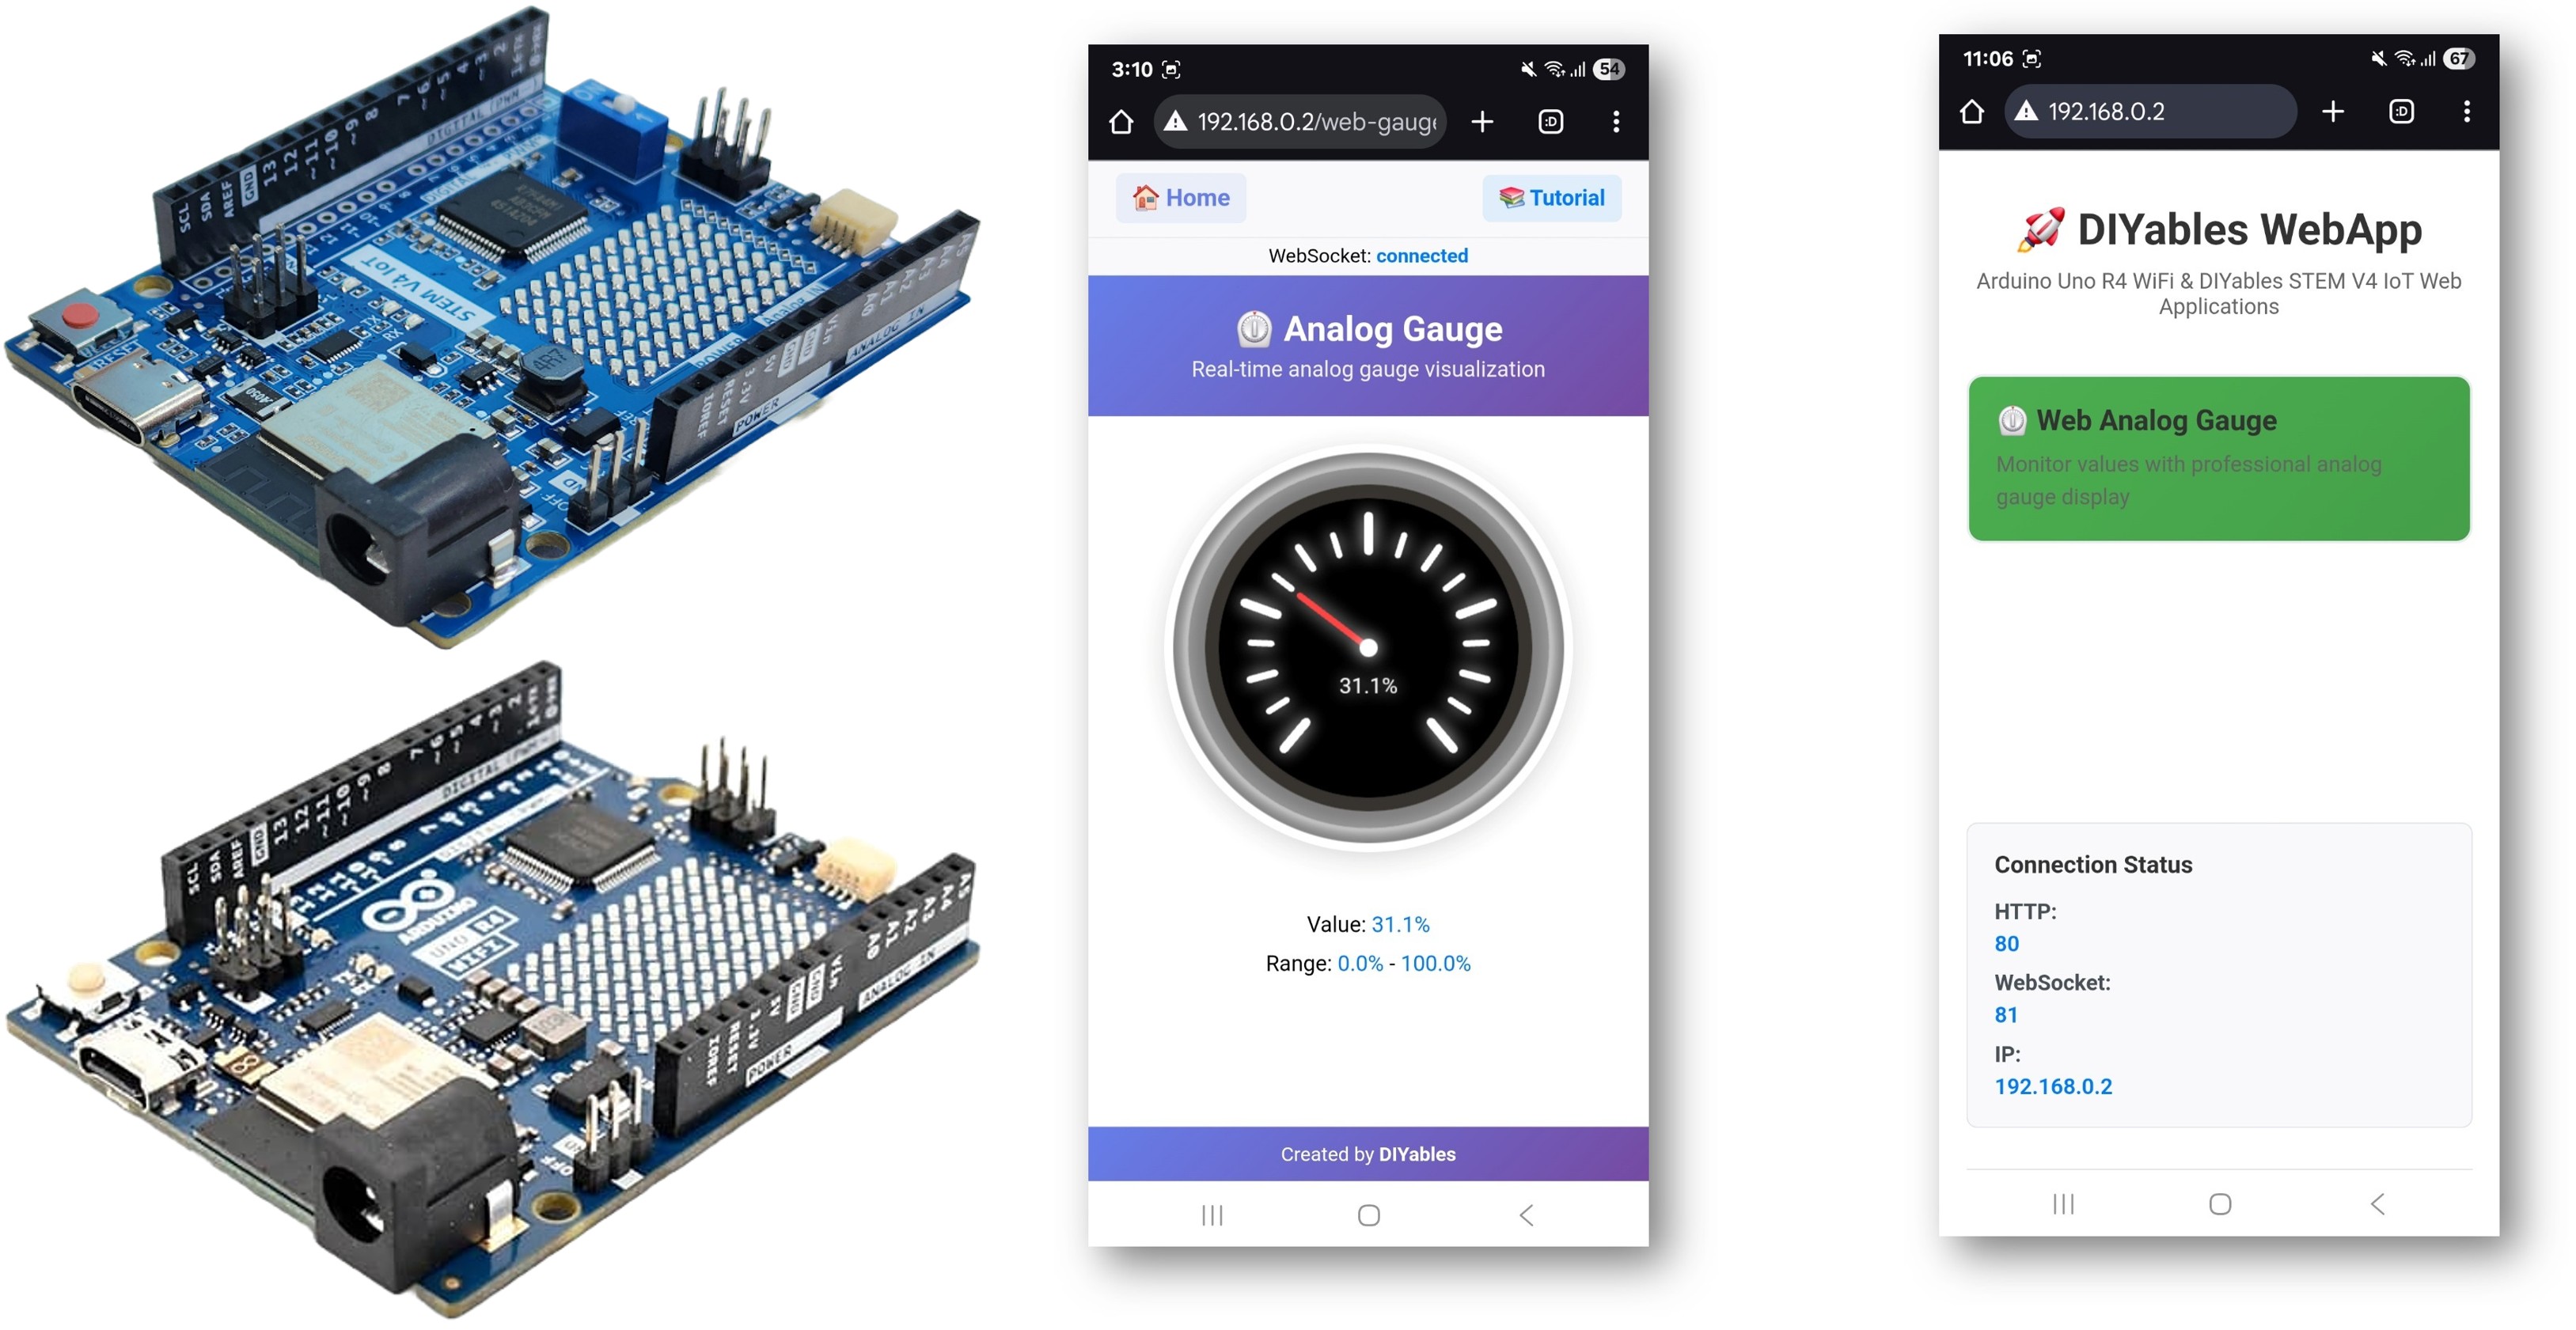
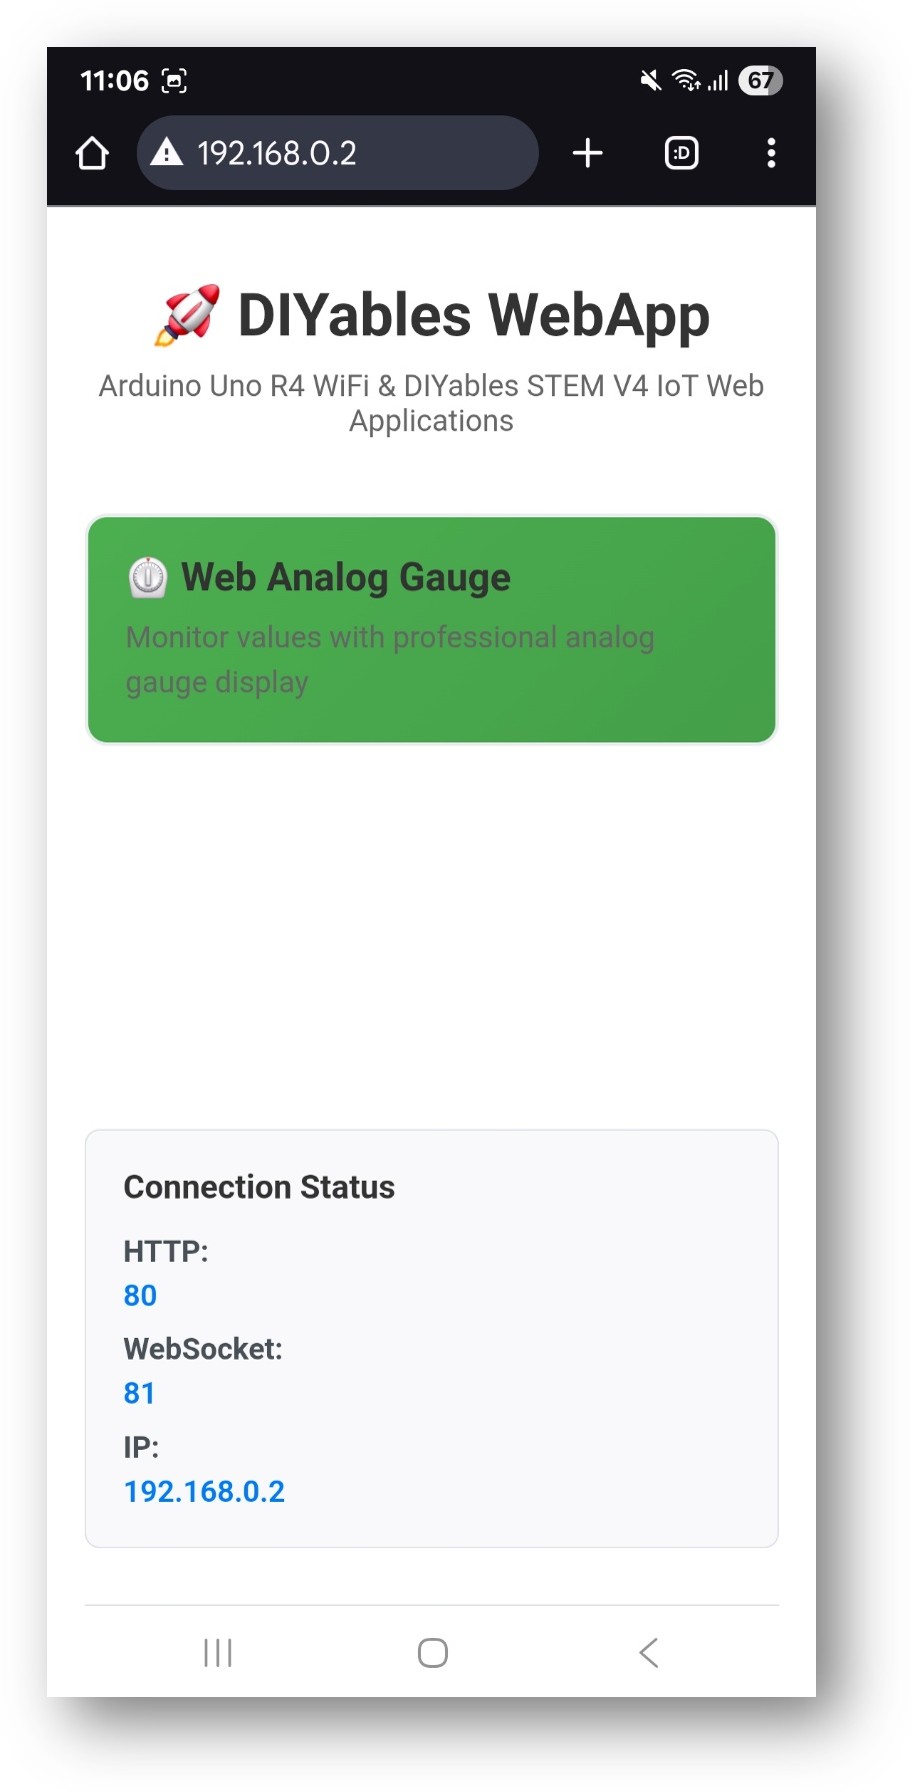
- You will see the home page like below image:
- Click to the Web Analog Gauge link, you will see the Web Analog Gauge app's UI like the below:
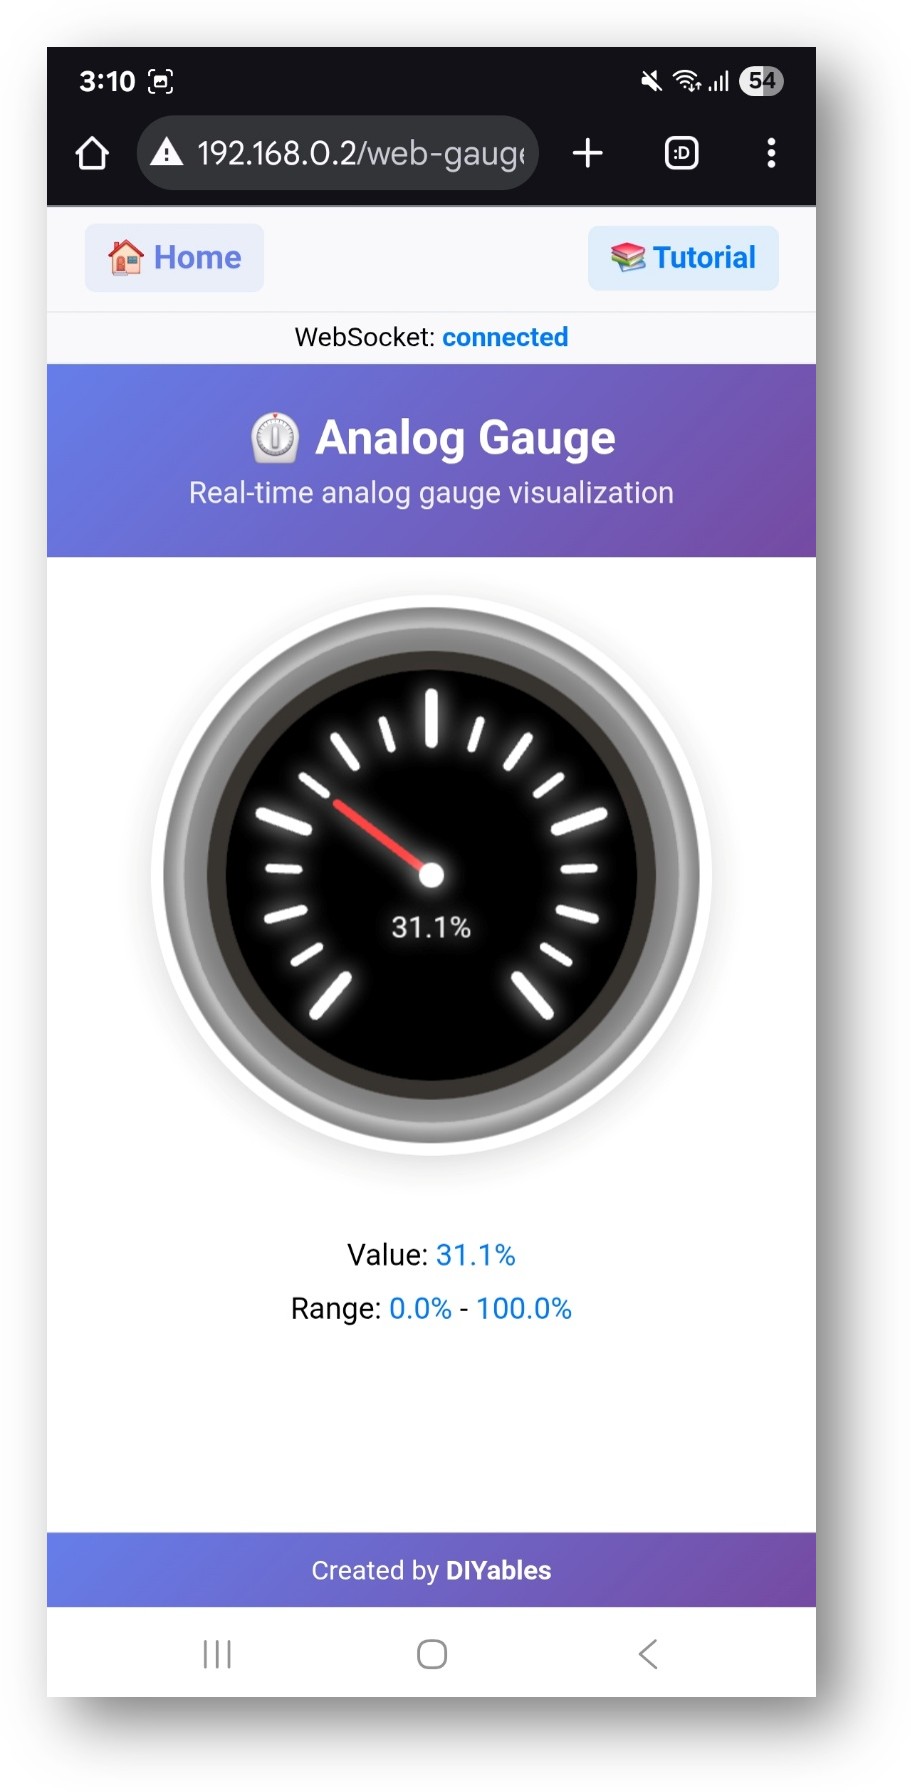
- Or you can also access the page directly by IP address followed by /web-analog-gauge. For example: http://192.168.1.100/web-analog-gauge
- You will see a professional circular gauge display showing real-time sensor values
Web Interface Features
Analog Gauge Display
- Circular Gauge: Professional gauge with smooth needle animation
- Value Range: Displays configured minimum and maximum values
- Current Reading: Real-time value display with units
- Color Zones: Visual status indication based on value ranges
- Precision: Configurable decimal places for accurate readings
Real-time Updates
- Live Data: Values update automatically via WebSocket connection
- Smooth Animation: Needle moves smoothly between values
- Status Feedback: Connection status indicator
- Mobile Optimized: Touch-friendly interface for all devices
Code Configuration
Gauge Setup
Sending Values
Customization Options
Range Configuration
- Minimum Value: Set lowest expected reading
- Maximum Value: Set highest expected reading
- Units: Display unit string (V, A, °C, PSI, etc.)
- Precision: Control decimal places in display
Sensor Integration
- Analog Sensors: Voltage, current, pressure, light sensors
- Digital Sensors: Temperature, humidity, gas sensors via I2C/SPI
- Calculated Values: Derived measurements from multiple sensors
- Calibrated Readings: Apply calibration factors for accuracy
Arduino Uno R4 Web Analog Gauge with Potentiometer
The below is complete code for adapting this web app with a potentiometer:
The below is a step-by-step video tutorial demonstrating how to use a potentiometer with the Web Analog Gauge app:
Common Use Cases
Educational Projects
- Voltage Monitoring: Battery voltage, power supply readings
- Environmental Sensing: Temperature, humidity, light levels
- Physics Experiments: Force, pressure, acceleration measurements
- Electronics Learning: Circuit analysis, component testing
Practical Applications
- Home Automation: System monitoring, environmental control
- Robotics: Sensor feedback, system diagnostics
- IoT Projects: Remote monitoring, data visualization
- Industrial: Quality control, process monitoring
Troubleshooting
Gauge Not Updating
- Check WiFi connection and WebSocket status
- Verify callback function is properly set
- Ensure gauge value is within configured range
- Check Serial Monitor for connection messages
Incorrect Values
- Verify sensor wiring and connections
- Check analog reference voltage settings
- Calibrate sensor readings if necessary
- Ensure proper scaling in callback function
Connection Issues
- Verify IP address in browser
- Check firewall settings
- Ensure 2.4GHz WiFi network (5GHz not supported)
- Try refreshing browser page
Advanced Features
Multiple Gauges
You can create multiple gauge instances for different sensors:
Data Logging
Combine with Web Plotter for historical data visualization:
Educational Integration
STEM Learning Objectives
- Data Visualization: Understanding analog-to-digital conversion
- Sensor Physics: Learning measurement principles
- Web Technologies: Real-time communication concepts
- Programming: Callback functions, data handling
Classroom Activities
- Sensor Comparison: Compare different sensor types and ranges
- Calibration Exercise: Learn measurement accuracy and precision
- System Integration: Combine multiple sensors and displays
- Problem Solving: Troubleshoot sensor and display issues
This example provides a comprehensive foundation for analog sensor monitoring and visualization, perfect for both educational and practical applications.