The WebPlotter example creates a real-time data visualization interface accessible through any web browser. Designed for Arduino Uno R4 WiFi and DIYables STEM V4 IoT educational platform with enhanced data processing capabilities, real-time plotting features, and seamless integration with sensor monitoring systems. Perfect for visualizing sensor data, debugging algorithms, or monitoring system performance in real-time.
Watch this step-by-step video tutorial demonstrating how to use a DHT11 sensor with the Web Plotter app:
Features
Real-time Data Plotting: Visualize sensor data as it streams from Arduino
Multiple Data Series: Plot up to 8 different data streams simultaneously
Auto-scaling: Automatic Y-axis scaling based on data range
Interactive Interface: Zoom, pan, and analyze data trends
WebSocket Communication: Instant updates with minimal latency
Responsive Design: Works on desktop, tablet, and mobile devices
Customizable Configuration: Adjustable plot titles, axis labels, and ranges
Platform Extensible: Currently implemented for Arduino Uno R4 WiFi, but can be extended for other hardware platforms. See DIYables_WebApps_ESP32
Disclosure: Some of the links provided in this section are Amazon affiliate links. We may receive a commission for any purchases made through these links at no additional cost to you. Additionally, some of these links are for products from our own brand, DIYables .
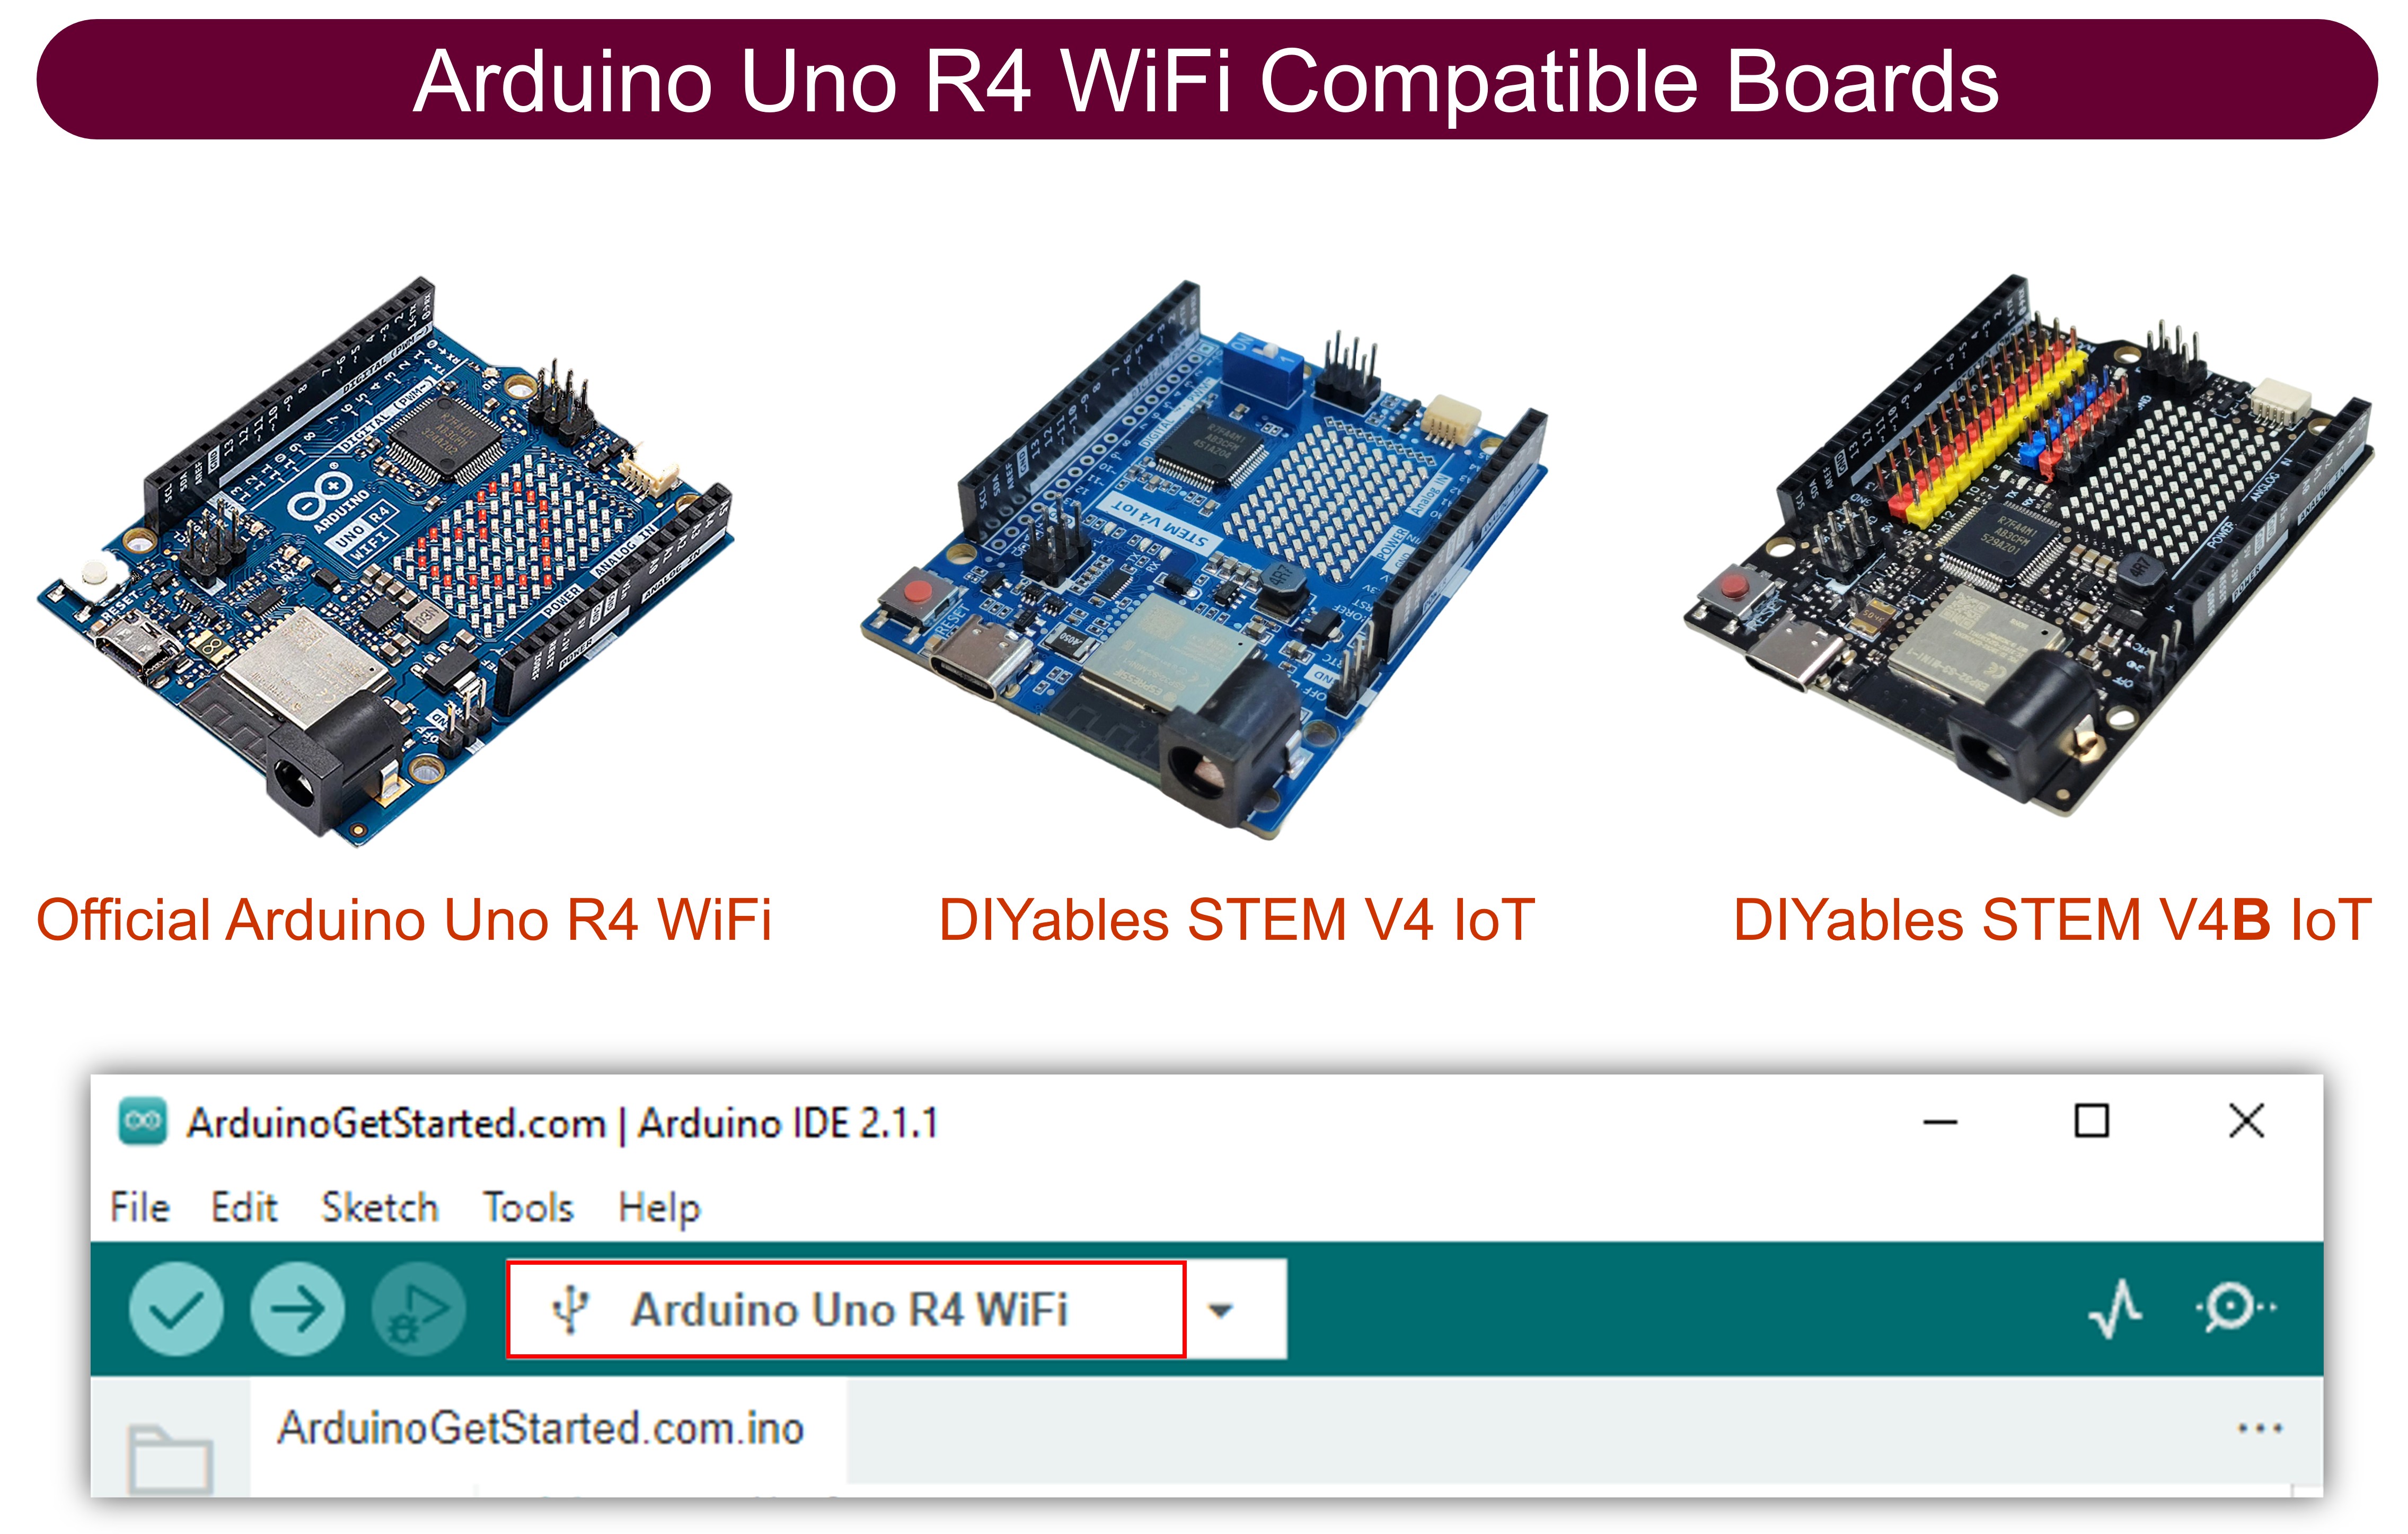
Connect the Arduino Uno R4/DIYables STEM V4 IoT board to your computer using a USB cable.
Launch the Arduino IDE on your computer.
Select the appropriate Arduino Uno R4 board (e.g., Arduino Uno R4 WiFi) and COM port.
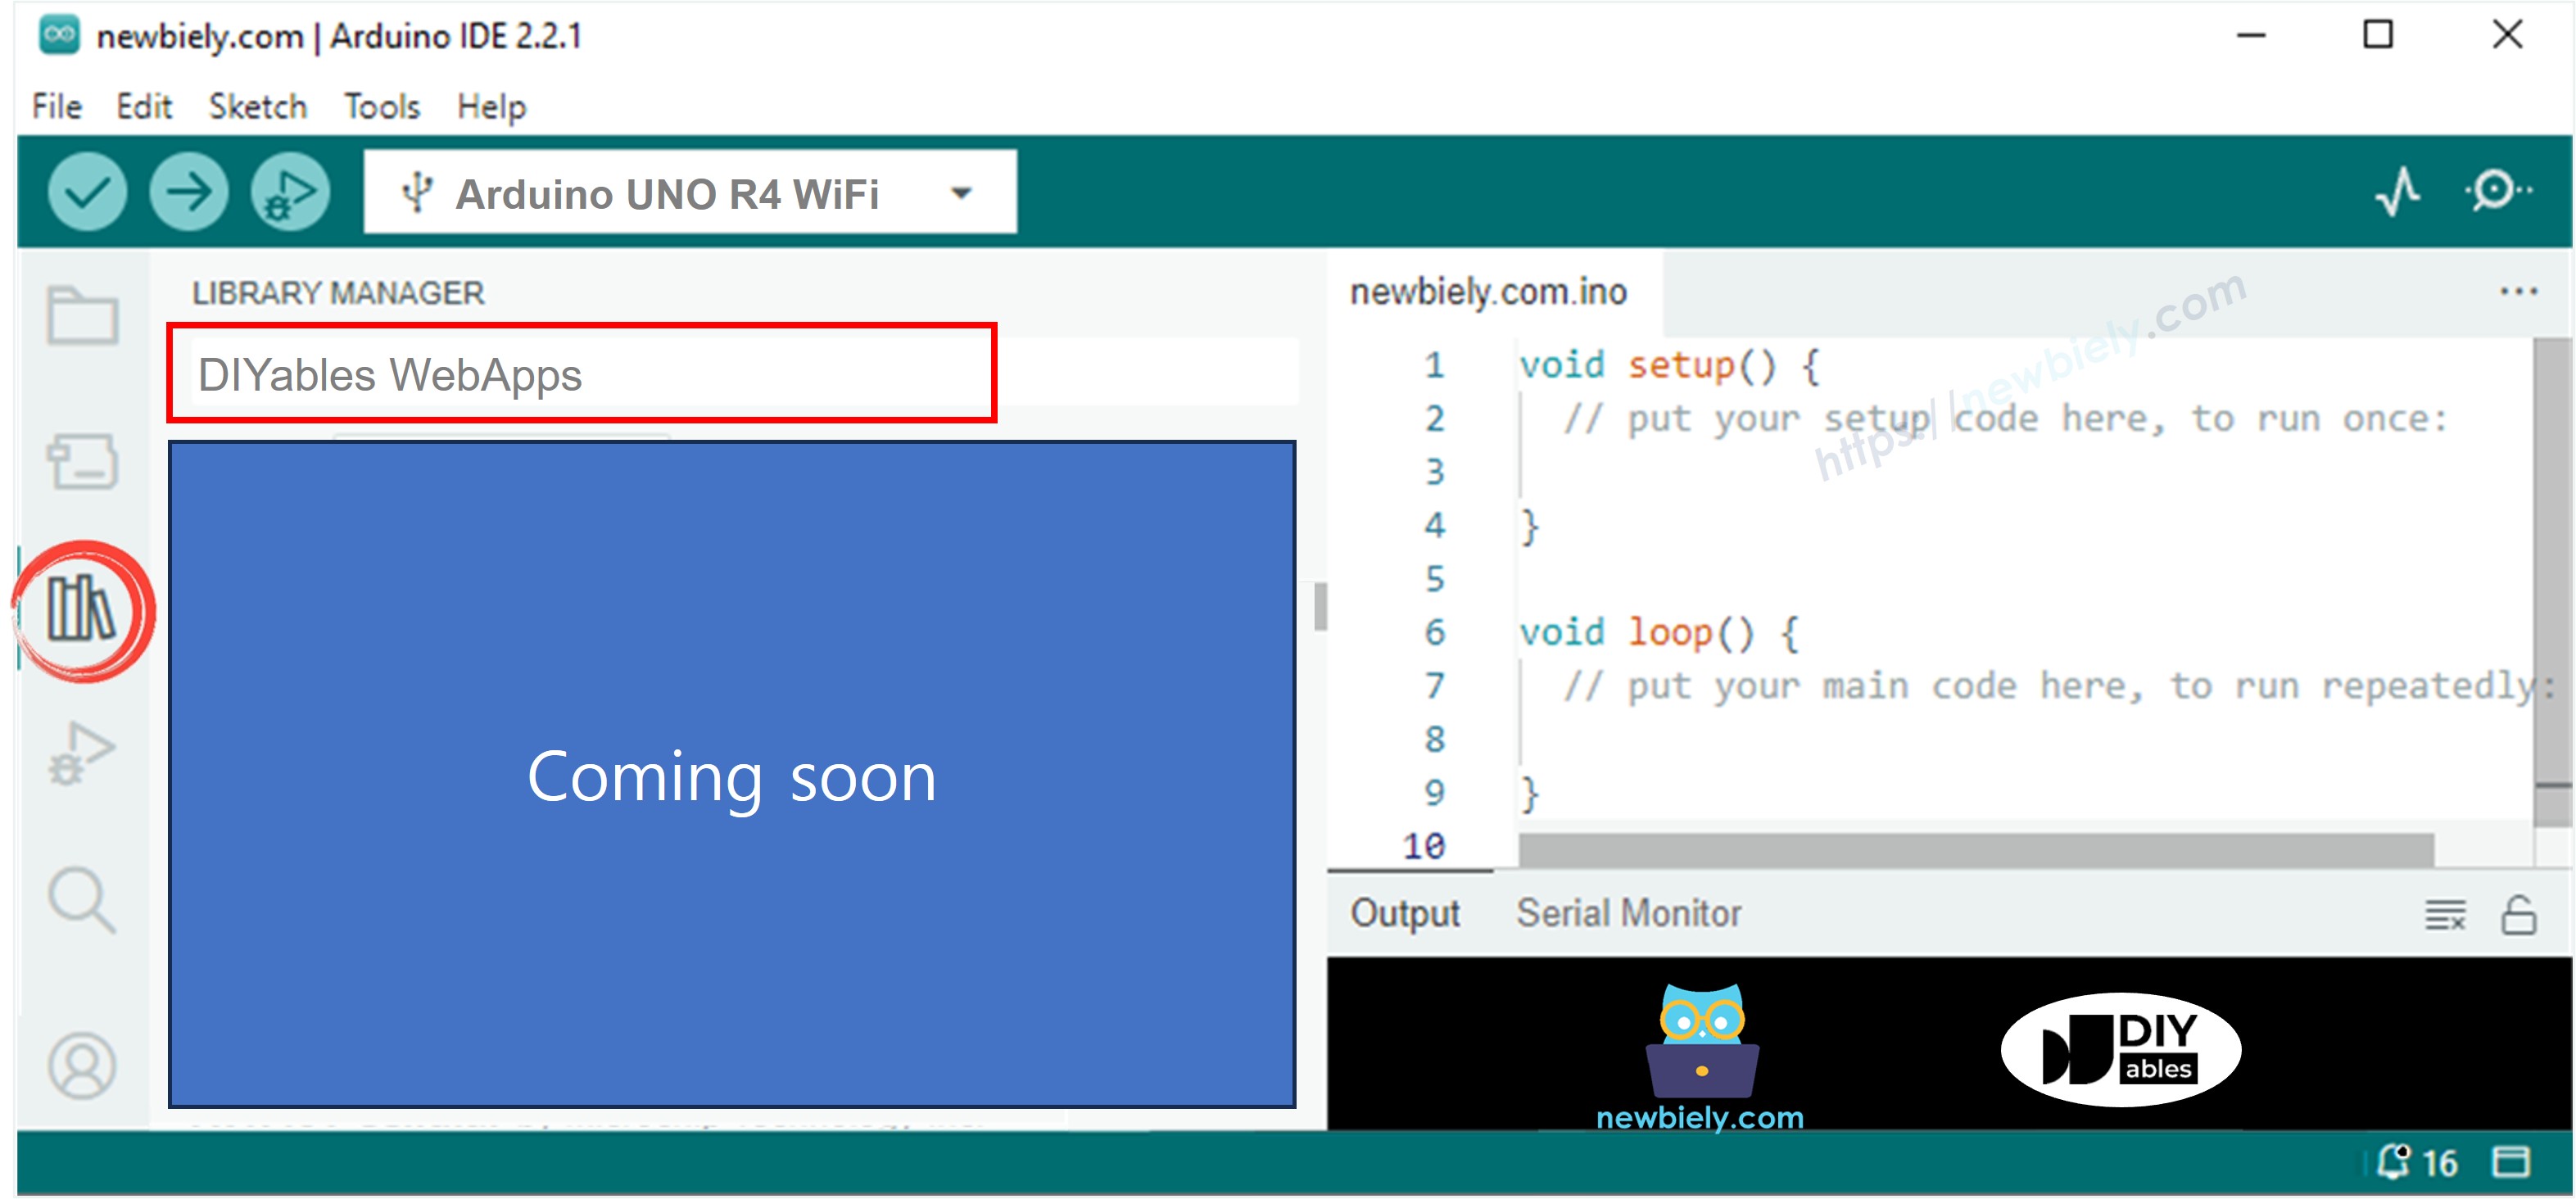
Navigate to the Libraries icon on the left bar of the Arduino IDE.
Search "DIYables WebApps", then find the DIYables WebApps library by DIYables
Click Install button to install the library.
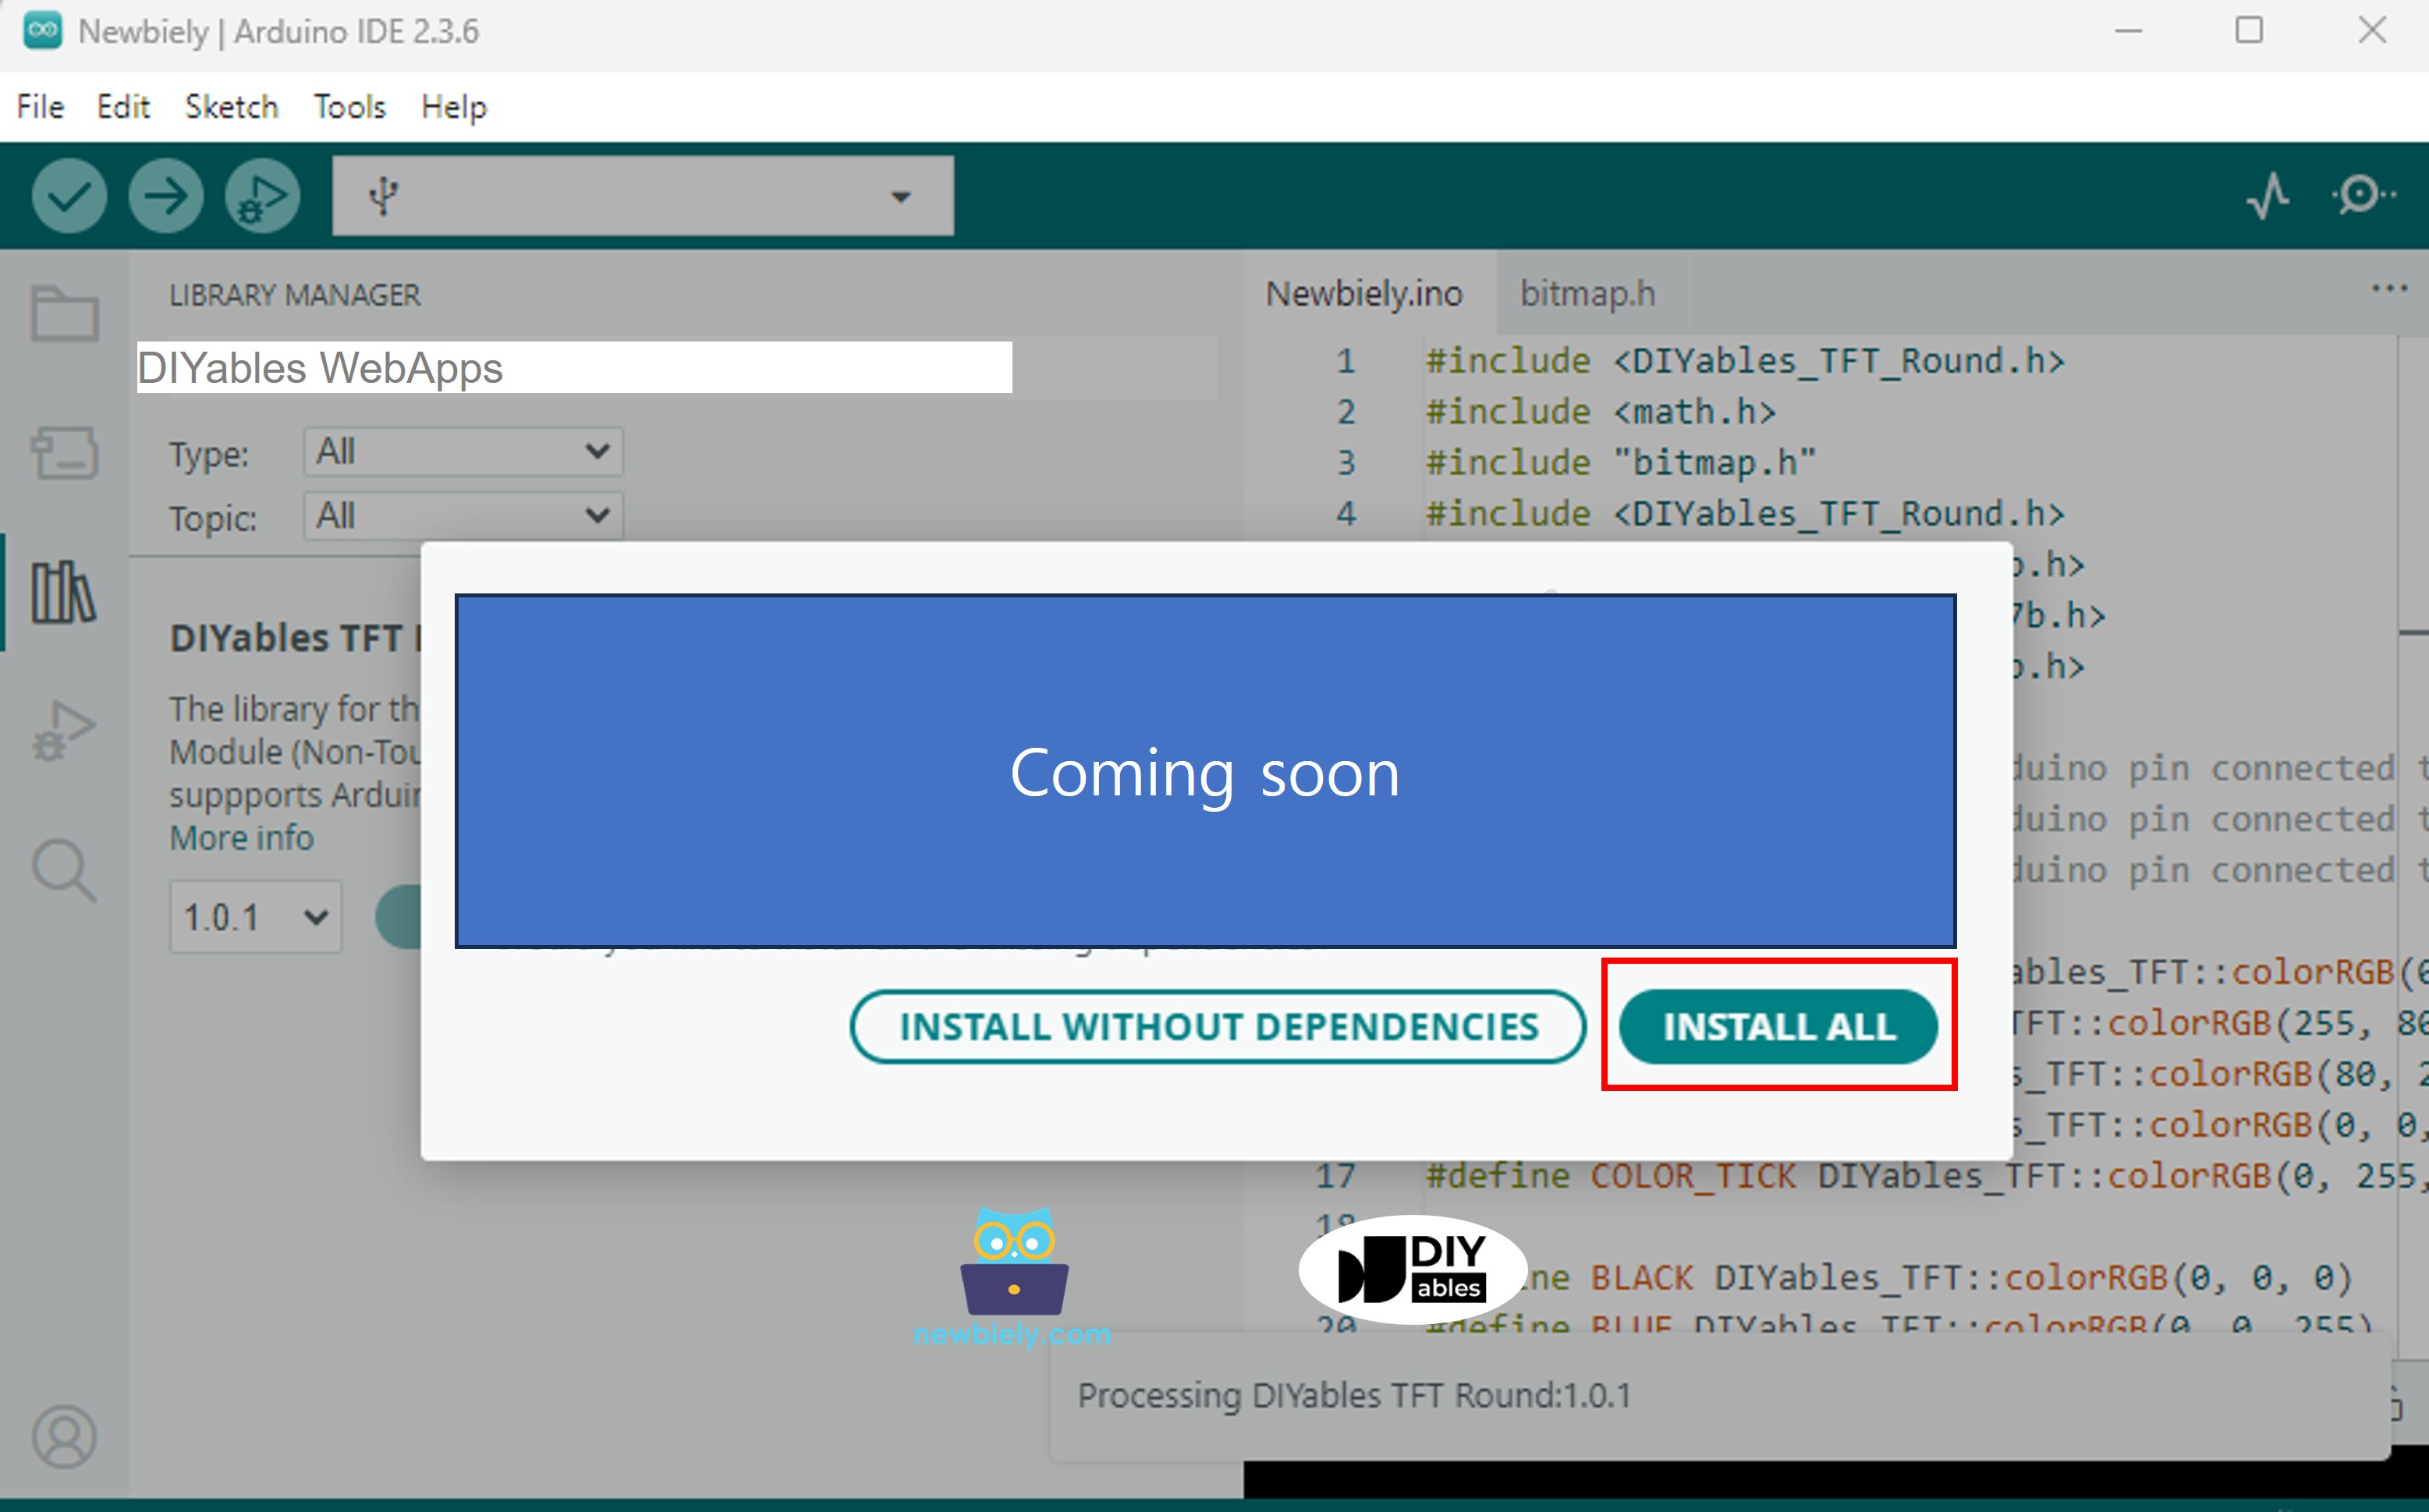
You will be asked for installing some other library dependencies
Click Install All button to install all library dependencies.
On Arduino IDE, Go to File Examples DIYables WebApps WebPlotter example, or copy the above code and paste it to the editor of Arduino IDE
/* * DIYables WebApp Library - Web Plotter Example * * This example demonstrates the Web Plotter feature: * - Real-time data visualization * - Multiple data series support * - Auto-scaling Y-axis * - Responsive web interface * - WebSocket communication for instant updates * * Hardware: Arduino Uno R4 WiFi or DIYables STEM V4 IoT * * Setup: * 1. Update WiFi credentials below * 2. Upload the sketch to your Arduino * 3. Open Serial Monitor to see the IP address * 4. Navigate to http://[IP_ADDRESS]/webplotter */#include <DIYablesWebApps.h>// WiFi credentials - UPDATE THESE WITH YOUR NETWORKconstchar WIFI_SSID[] = "YOUR_WIFI_SSID";constchar WIFI_PASSWORD[] = "YOUR_WIFI_PASSWORD";// Create WebApp server and page instancesUnoR4ServerFactory serverFactory;DIYablesWebAppServerwebAppsServer(serverFactory, 80, 81);DIYablesHomePage homePage;DIYablesWebPlotterPage webPlotterPage;// Simulation variablesunsignedlong lastDataTime = 0;constunsignedlong DATA_INTERVAL = 1000; // Send data every 1000msfloat timeCounter = 0;voidsetup() {Serial.begin(9600);delay(1000);// TODO: Initialize your hardware pins and sensors hereSerial.println("DIYables WebApp - Web Plotter Example");// Add home and web plotter pageswebAppsServer.addApp(&homePage);webAppsServer.addApp(&webPlotterPage);// Optional: Add 404 page for better user experiencewebAppsServer.setNotFoundPage(DIYablesNotFoundPage());// Configure the plotter webPlotterPage.setPlotTitle("Real-time Data Plotter"); webPlotterPage.setAxisLabels("Time (s)", "Values"); webPlotterPage.enableAutoScale(true); webPlotterPage.setMaxSamples(50);// Start the WebApp serverif (!webAppsServer.begin(WIFI_SSID, WIFI_PASSWORD)) {while (1) {Serial.println("Failed to start WebApp server!");delay(1000); } }// Set up callbacks webPlotterPage.onPlotterDataRequest([]() {Serial.println("Web client requested data"); sendSensorData(); });Serial.println("\nWebPlotter is ready!");Serial.println("Usage Instructions:");Serial.println("1. Connect to the WiFi network");Serial.println("2. Open your web browser"); Serial.println("3. Navigate to the Arduino's IP address"); Serial.println("4. Click on 'Web Plotter' to view real-time data"); Serial.println("\nGenerating simulated sensor data...");}void loop() {// Handle web server and WebSocket connectionswebAppsServer.loop();// Send sensor data at regular intervalsif (millis() - lastDataTime >= DATA_INTERVAL) { lastDataTime = millis(); sendSensorData(); timeCounter += DATA_INTERVAL / 1000.0; // Convert to seconds }}void sendSensorData() {// Generate simulated sensor data// In a real application, replace these with actual sensor readings// Simulated temperature sensor (sine wave with noise)float temperature = 25.0 + 5.0 * sin(timeCounter * 0.5) + random(-100, 100) / 100.0;// Simulated humidity sensor (cosine wave)float humidity = 50.0 + 20.0 * cos(timeCounter * 0.3);// Simulated light sensor (triangle wave)float light = 512.0 + 300.0 * (2.0 * abs(fmod(timeCounter * 0.2, 2.0) - 1.0) - 1.0);// Simulated analog pin readingfloat analogValue = analogRead(A0);// Send data using different methods:// Method 1: Send individual values (uncomment to use)// webPlotterPage.sendPlotData(temperature);// Method 2: Send multiple values at once webPlotterPage.sendPlotData(temperature, humidity, light / 10.0, analogValue / 100.0);// Method 3: Send array of values (alternative approach)// float values[] = {temperature, humidity, light / 10.0, analogValue / 100.0};// webPlotterPage.sendPlotData(values, 4);// Method 4: Send raw data string (for custom formatting)// String dataLine = String(temperature, 2) + " " + String(humidity, 1) + " " + String(light / 10.0, 1);// webPlotterPage.sendPlotData(dataLine);// Print to Serial Monitor in Serial Plotter compatible format// Format: Temperature Humidity Light Analog (tab-separated for Serial Plotter)Serial.print(temperature, 1);Serial.print("\t");Serial.print(humidity, 1);Serial.print("\t");Serial.print(light / 10.0, 1);Serial.print("\t");Serial.println(analogValue / 100.0, 2);}
Configure WiFi credentials in the code by updating these lines:
Click Upload button on Arduino IDE to upload code to Arduino UNO R4/DIYables STEM V4 IoT
Open the Serial Monitor
Check out the result on Serial Monitor. It looks like the below
Newbiely | Arduino IDE 2.3.8
──
☐
✕
File
Edit
Sketch
Tools
Help
Arduino Uno R4 WiFi
Newbiely.ino
···
8Serial.println("Hello World!");
Output
Serial Monitor
Message (Enter to send message to 'Arduino Uno R4 WiFi' on 'COM15')
New Line
9600 baud
DIYables WebApp - Web Plotter Example
INFO: Added app /
INFO: Added app /web-plotter
DIYables WebApp Library
Platform: Arduino Uno R4 WiFi
Network connected!
IP address: 192.168.0.2
HTTP server started on port 80
Configuring WebSocket server callbacks...
WebSocket server started on port 81
WebSocket URL: ws://192.168.0.2:81
WebSocket server started on port 81
==========================================
DIYables WebApp Ready!
==========================================
📱 Web Interface: http://192.168.0.2
🔗 WebSocket: ws://192.168.0.2:81
📋 Available Applications:
🏠 Home Page: http://192.168.0.2/
📊 Web Plotter: http://192.168.0.2/web-plotter
==========================================
Ln 11, Col 1
Arduino Uno R4 WiFi on COM15
2
If you do not see anything, reboot Arduino board.
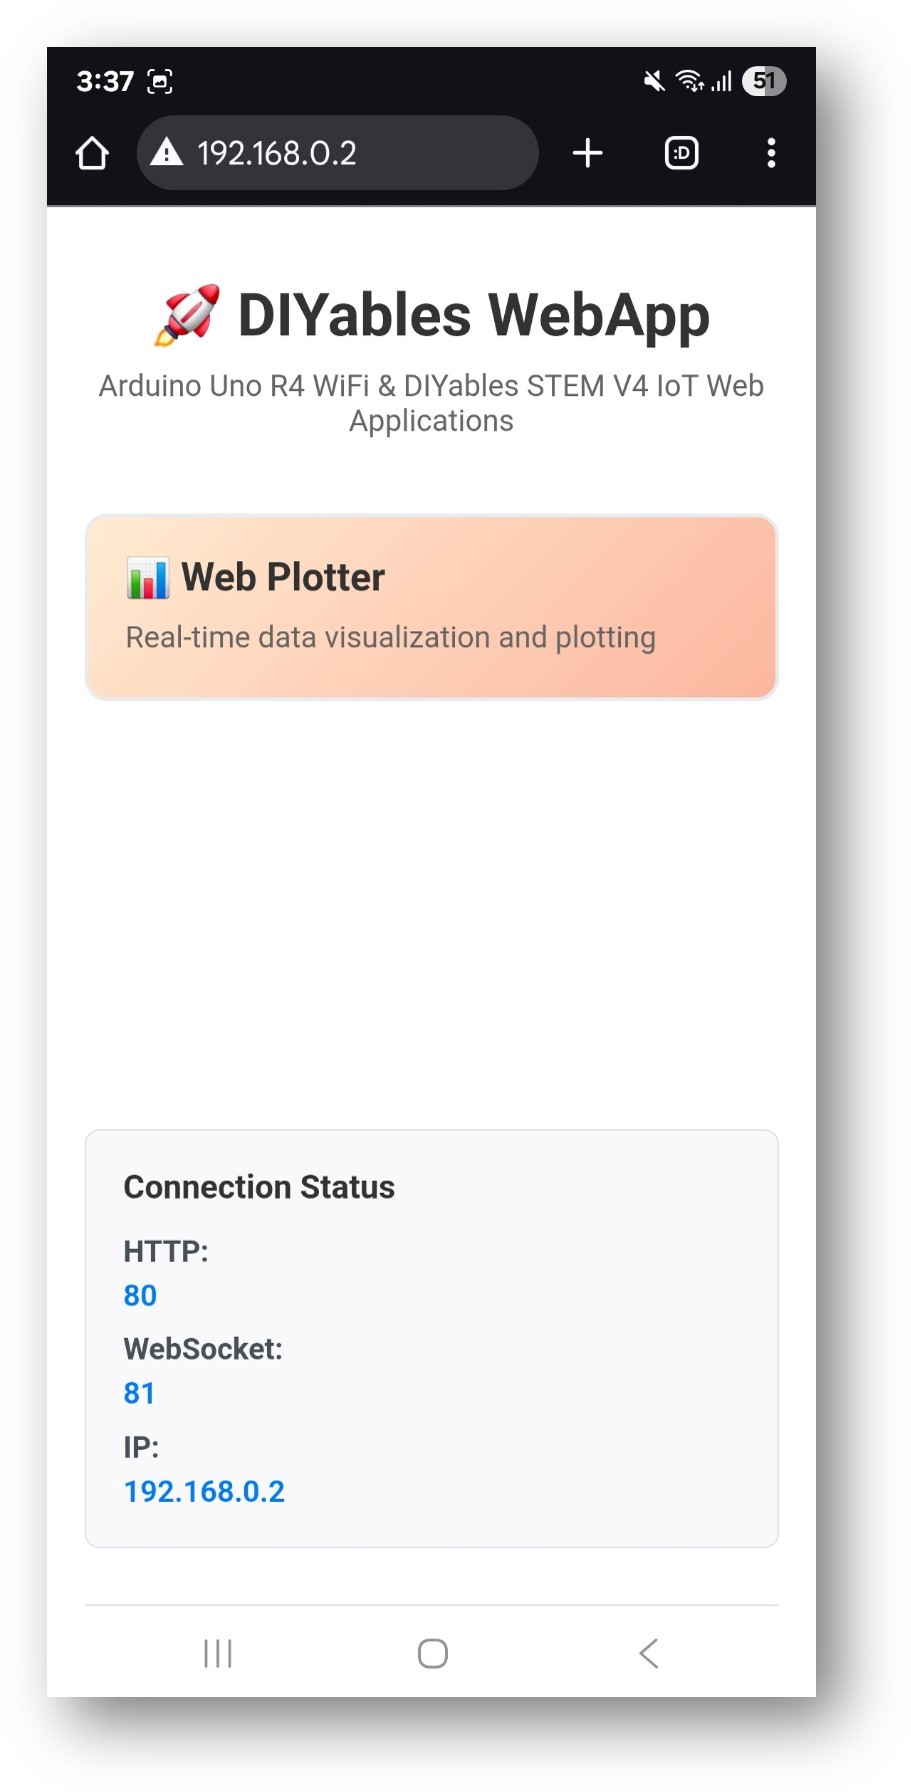
Take note of the IP address displayed, and enter this address into the address bar of a web browser on your smartphone or PC.
Example: http://192.168.0.2
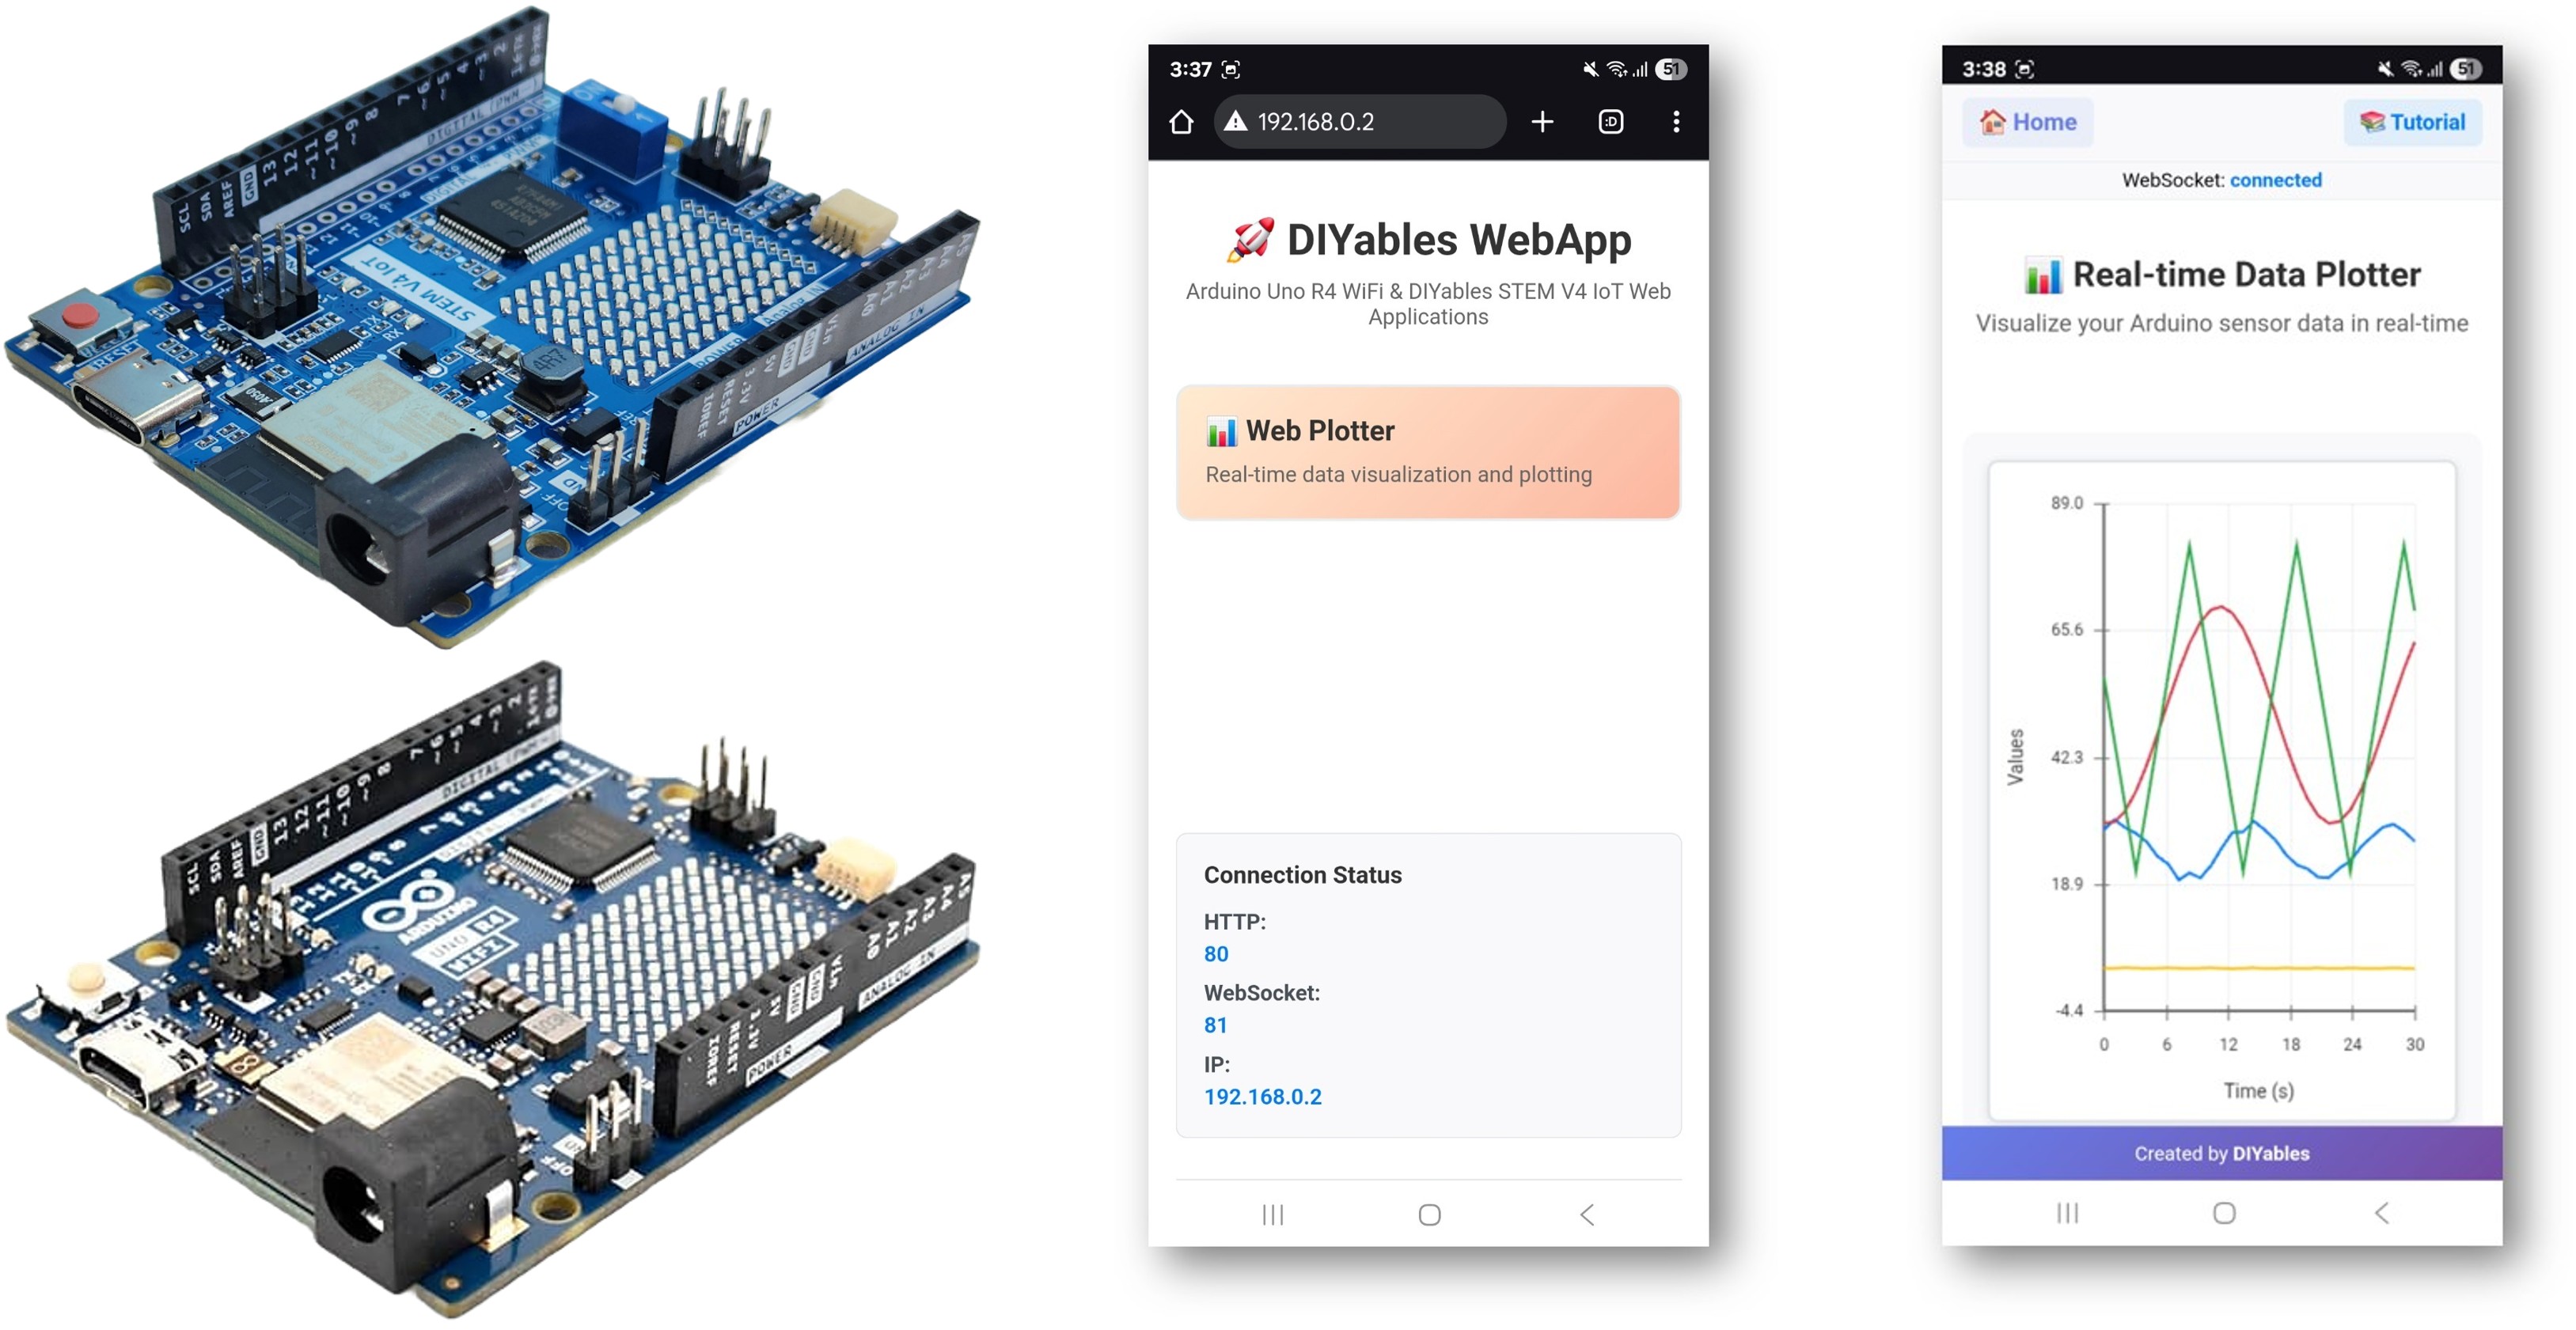
You will see the home page like below image:
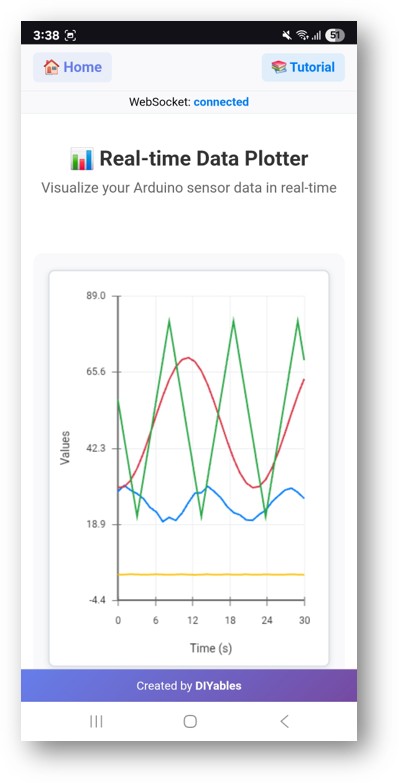
Click to the Web Plotter link, you will see the Web Plotter app's UI like the below:
Or you can also access the page directly by IP address followed by /web-plotter. For example: http://192.168.0.2/web-plotter
Watch as the Arduino generates simulated sensor data and plots it in real-time. You'll see multiple colored lines representing different data streams.
Creative Customization - Visualize Your Data Creatively
Transform the plotting interface to match your unique project requirements and create stunning data visualizations:
Data Source Configuration
Replace simulated data with real sensor readings:
Method 1: Single Sensor Reading
void sendTemperatureData() {float temperature = analogRead(A0) * (5.0 / 1023.0) * 100; // LM35 temperature sensor webPlotterPage.sendPlotData(temperature);}
float movingAverage(float newValue) {staticfloat readings[10];staticint index = 0;staticfloat total = 0; total -= readings[index]; readings[index] = newValue; total += readings[index]; index = (index + 1) % 10;return total / 10.0;}void sendFilteredData() {float rawValue = analogRead(A0);float filteredValue = movingAverage(rawValue); webPlotterPage.sendPlotData(rawValue / 10.0, filteredValue / 10.0);}
Data Logging with Timestamps
void sendTimestampedData() {unsignedlong currentTime = millis() / 1000;float sensorValue = analogRead(A0) / 10.0;// Send time and value as separate data series webPlotterPage.sendPlotData(currentTime, sensorValue);// Also log to Serial for debuggingSerial.print("Time: ");Serial.print(currentTime);Serial.print("s, Value: ");Serial.println(sensorValue);}
Please feel free to share the link of this tutorial. However, Please do not use our content on any other websites. We invested a lot of effort and time to create the content, please respect our work!