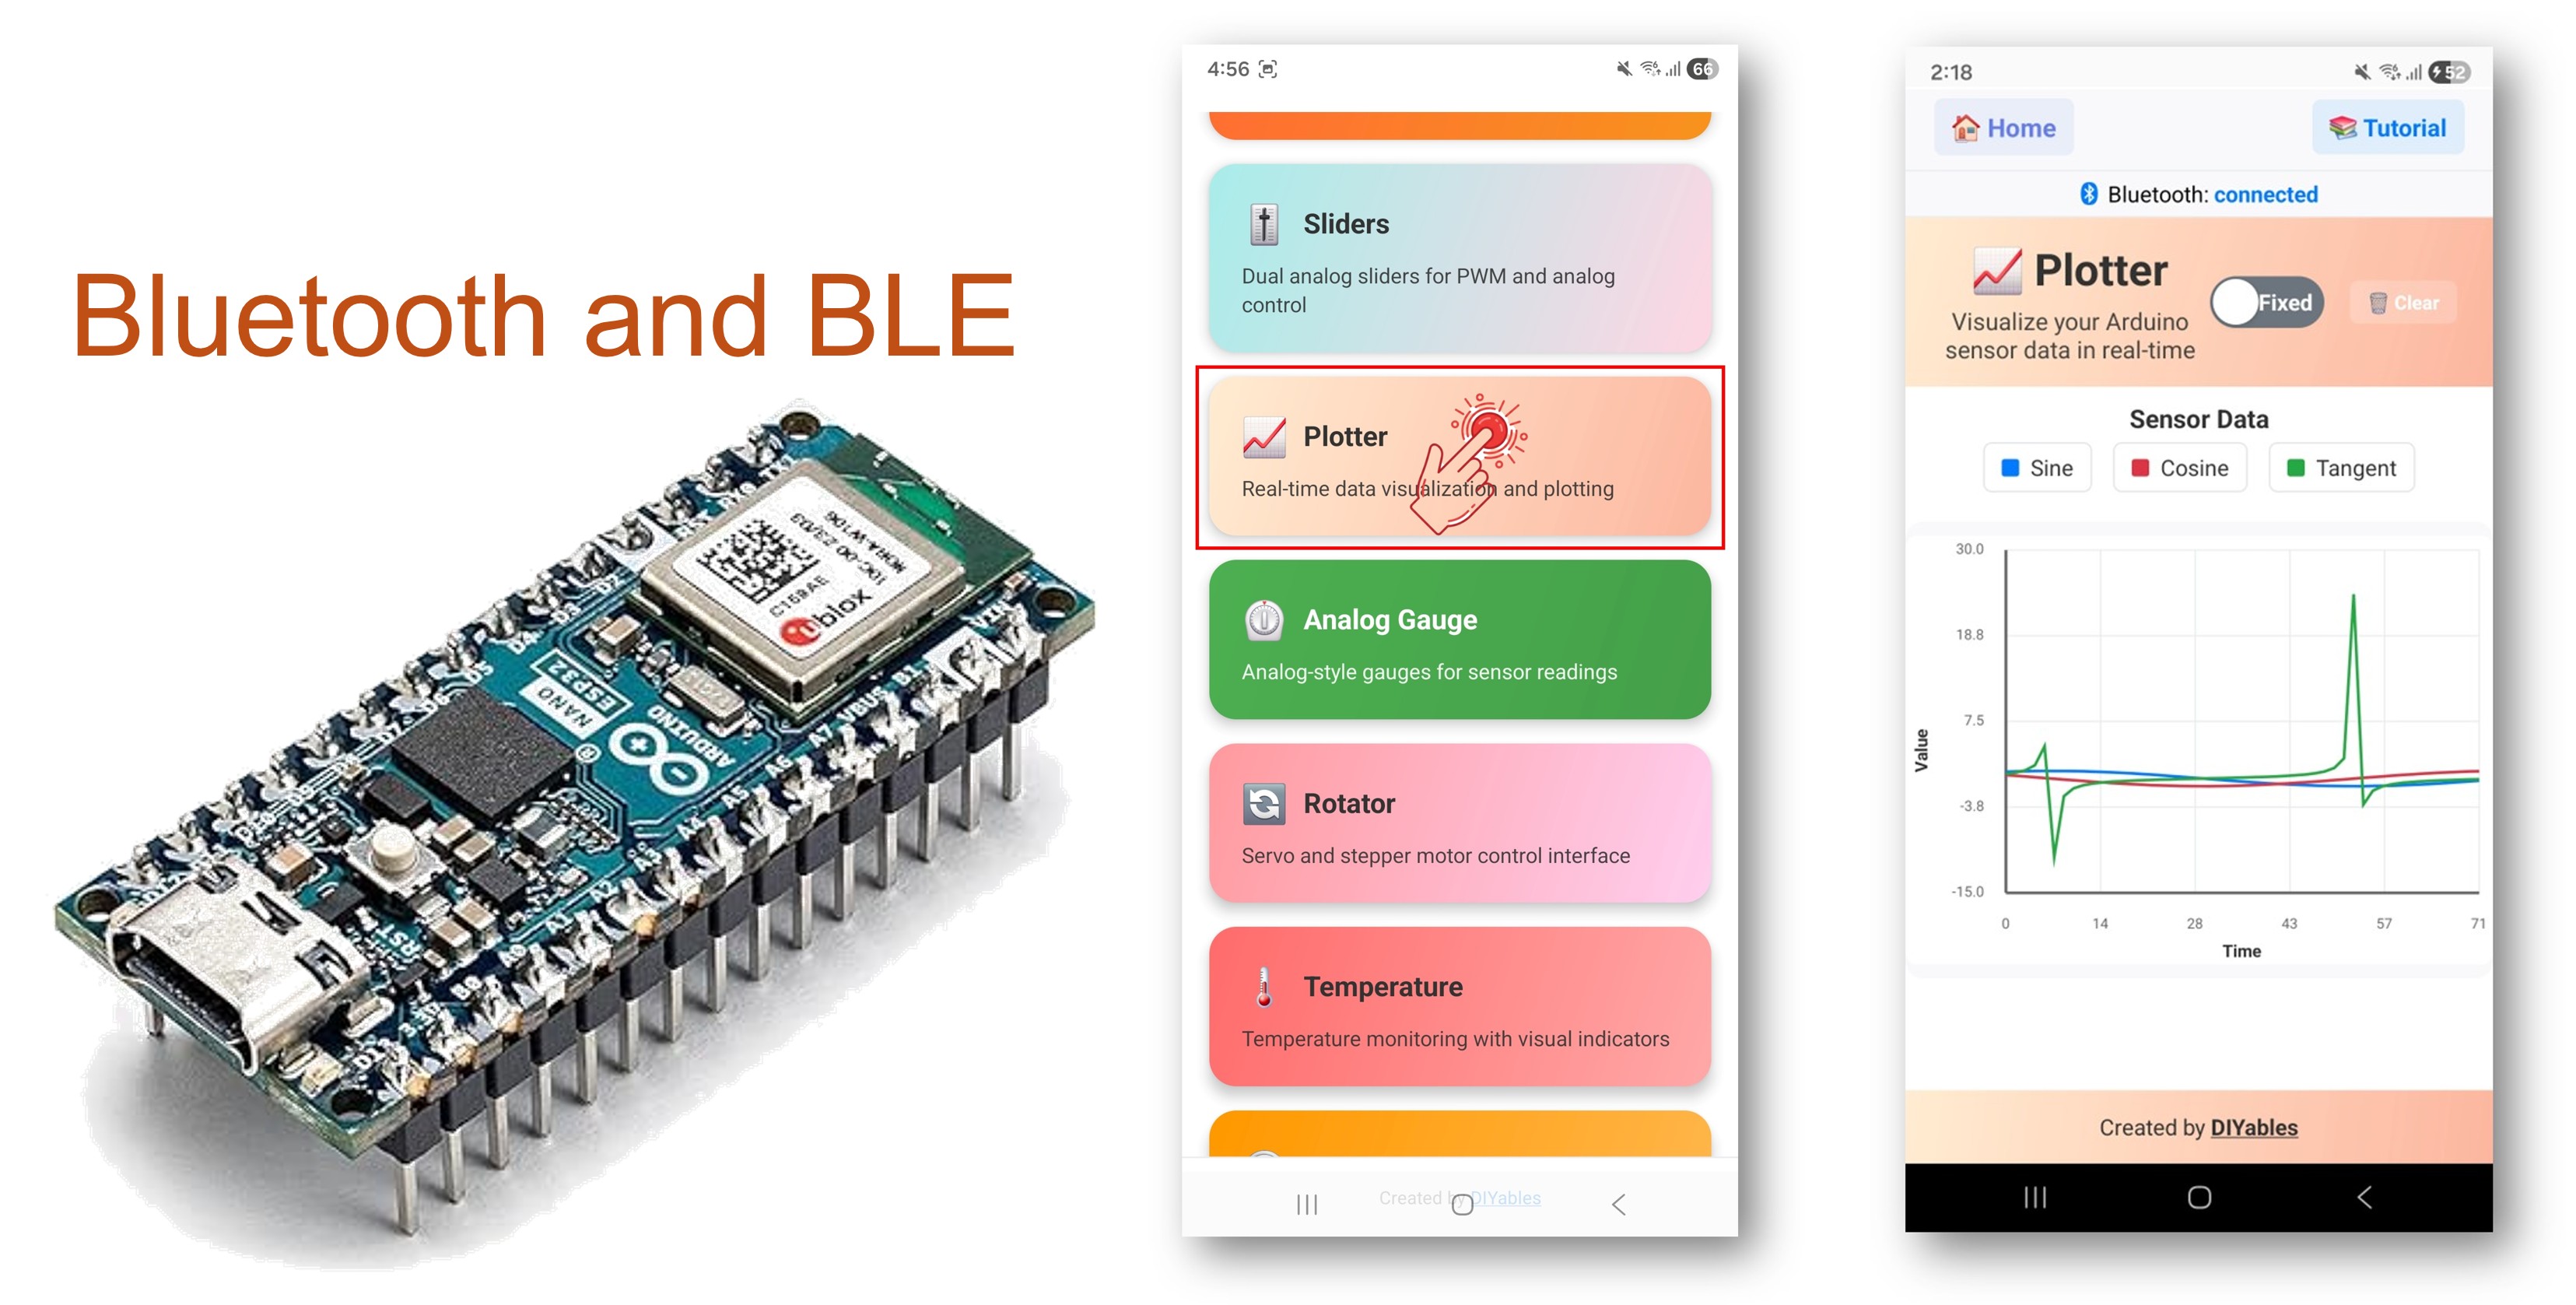
Arduino Nano ESP32 - DIYables Bluetooth App Plotter

Overview

This example streams real-time data to the DIYables Bluetooth STEM app for live visualisation on the Arduino Nano ESP32 using BLE (Bluetooth Low Energy). Plot sensor readings, waveforms, and multi-channel data as live graphs on a smartphone. Suitable for data logging, signal analysis, sensor calibration, and scientific experiments.

Note: The Arduino Nano ESP32 supports BLE only — Classic Bluetooth is not supported. The DIYables Bluetooth App works on both Android and iOS with BLE.

Arduino Nano ESP32 Bluetooth Plotter Example - Real-Time Data Visualization via BLE Tutorial

Features

  • Multi-Channel Plotting: Up to 6 data channels simultaneously
  • Configurable Axes: Custom titles, labels, and Y-axis range
  • Legend Labels: Name each data channel for clarity
  • Sample Limit: Set maximum number of displayed samples
  • Fast Streaming: Up to 10 updates per second (100 ms interval)
  • Android & iOS Support: BLE is compatible with both platforms
  • No Pairing Required: BLE connects without manual pairing

Hardware Preparation

1×Arduino Nano ESP32
1×USB Cable Type-A to Type-C (for USB-A PC)
1×USB Cable Type-C to Type-C (for USB-C PC)
1×Recommended: Screw Terminal Expansion Board for Arduino Nano
1×Recommended: Breakout Expansion Board for Arduino Nano
1×Recommended: Power Splitter for Arduino Nano ESP32

Or you can buy the following kits:

1×DIYables Sensor Kit (30 sensors/displays)
1×DIYables Sensor Kit (18 sensors/displays)
Disclosure: Some of the links provided in this section are Amazon affiliate links. We may receive a commission for any purchases made through these links at no additional cost to you.
Additionally, some of these links are for products from our own brand, DIYables .

Arduino Nano ESP32 Code

Detailed Instructions

  • New to the Arduino Nano ESP32? Start with the Arduino Nano ESP32 getting started guide.
  • Connect the Arduino Nano ESP32 to your computer via USB.
  • Open Arduino IDE.
  • Select the Arduino Nano ESP32 board and the correct COM port.
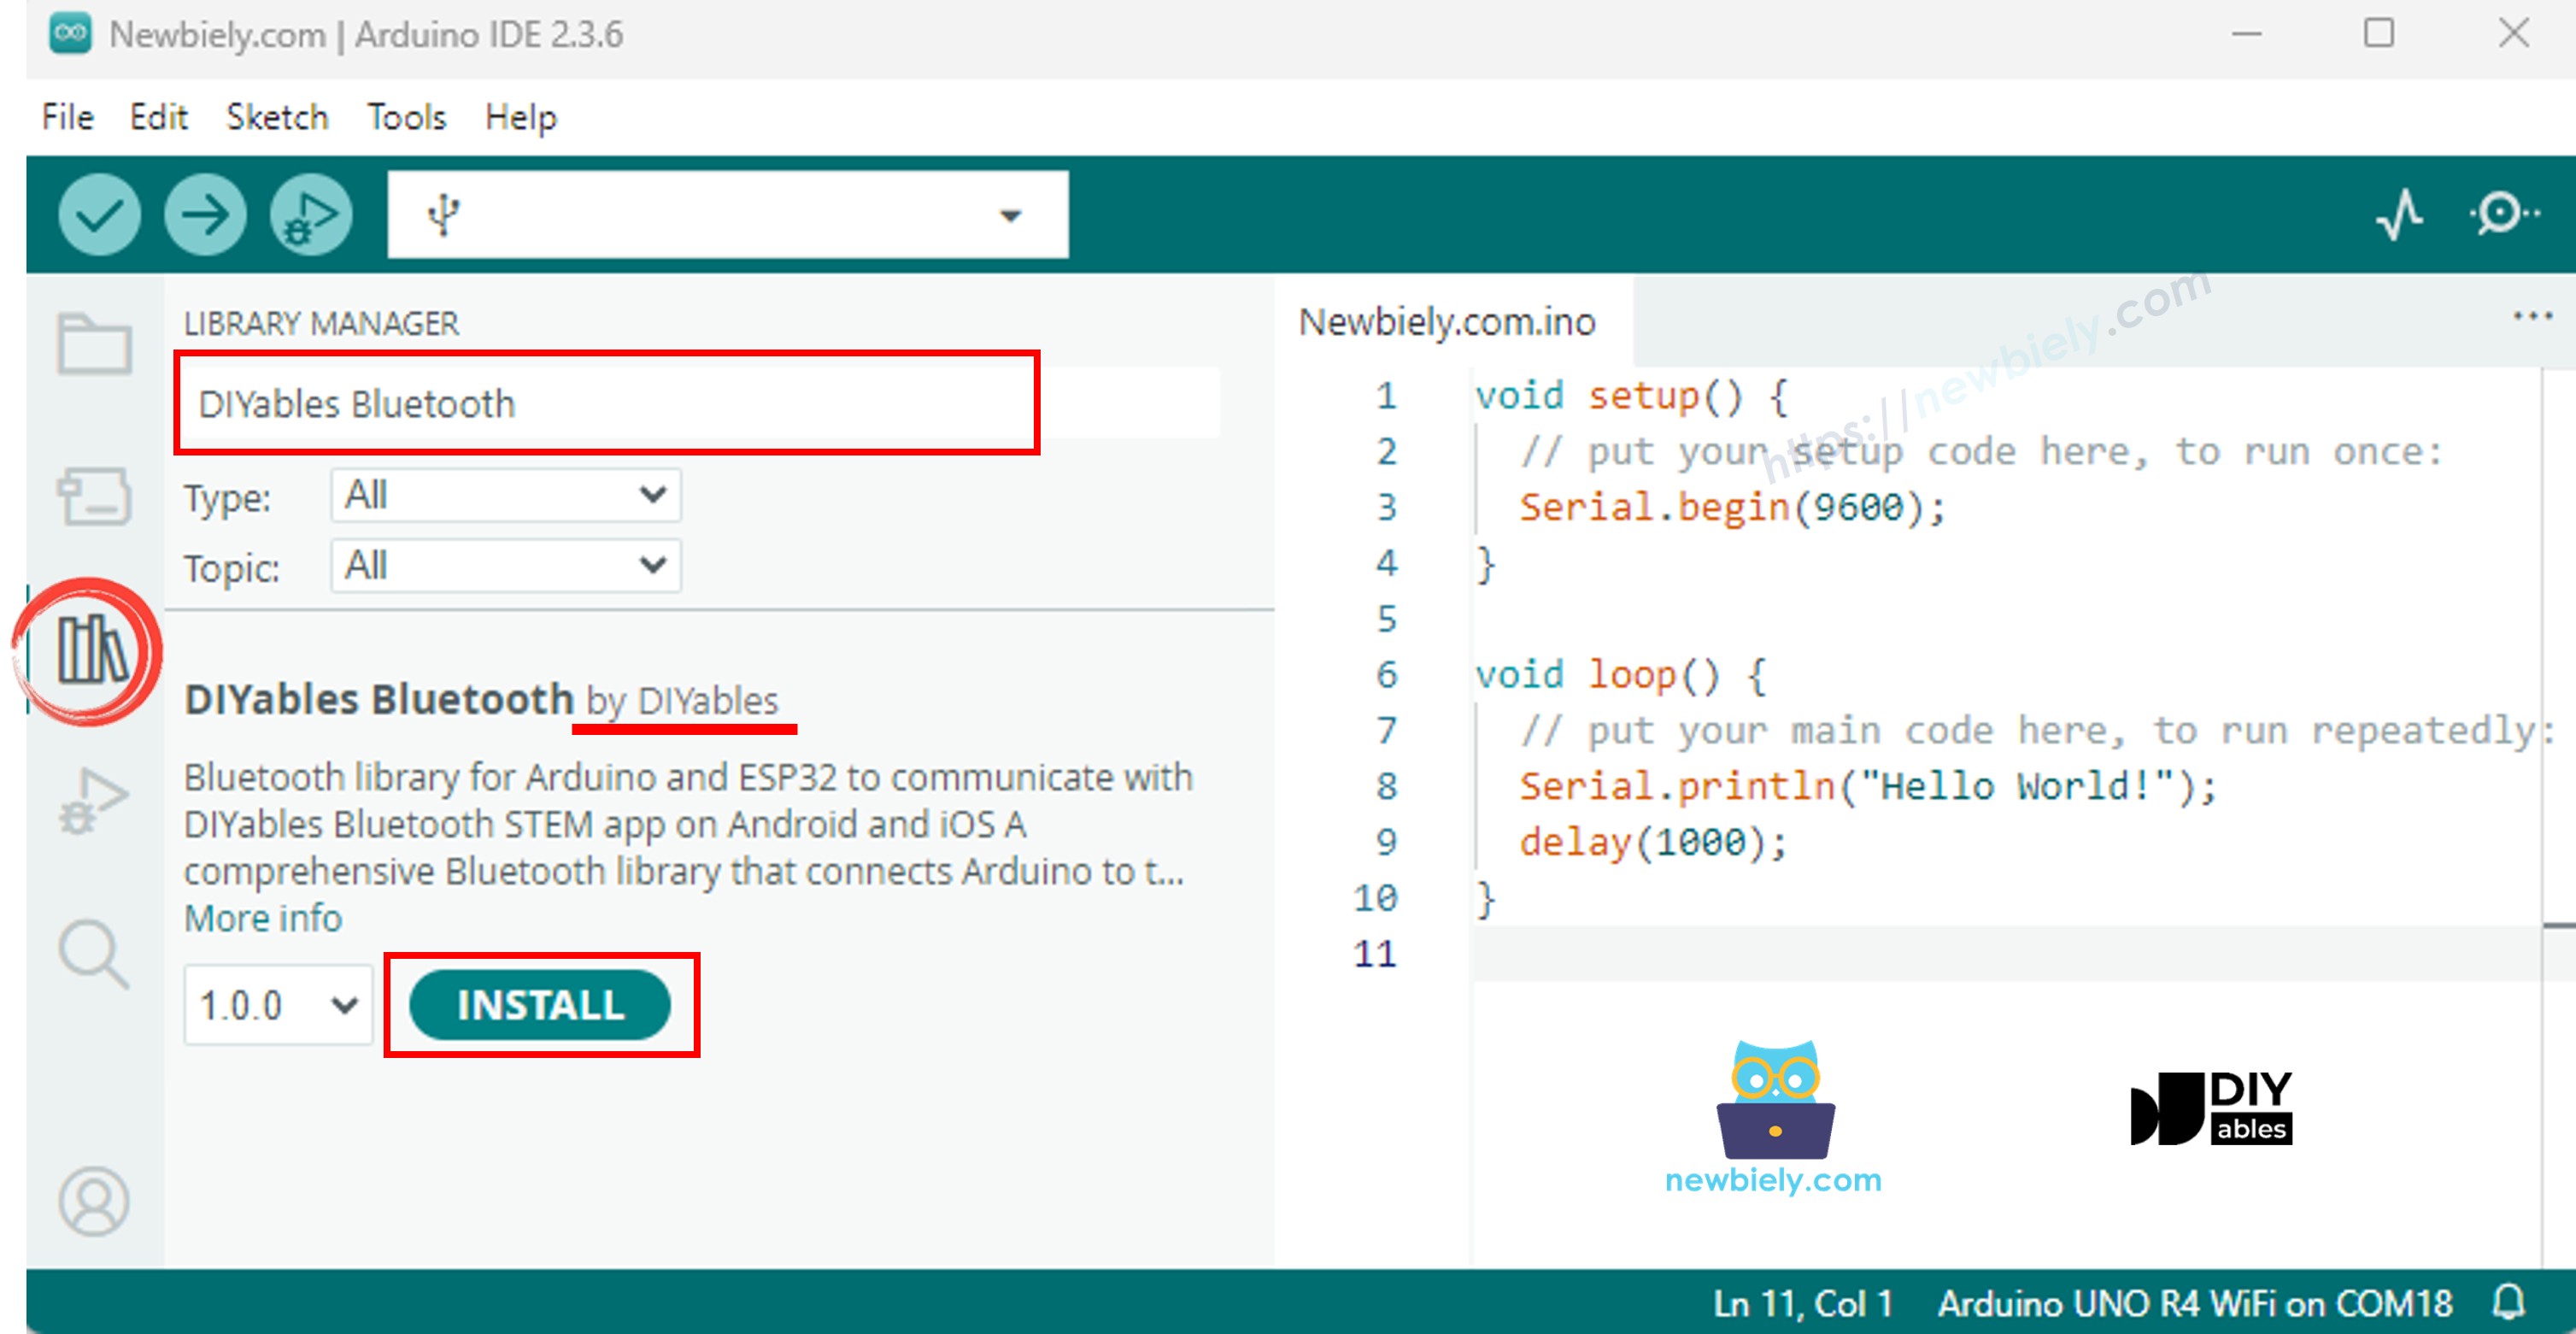
  • Click the Libraries icon in the left sidebar.
  • Search for "DIYables Bluetooth" and select the DIYables Bluetooth library by DIYables.
  • Click Install.
Arduino Nano ESP32 DIYables Bluetooth library
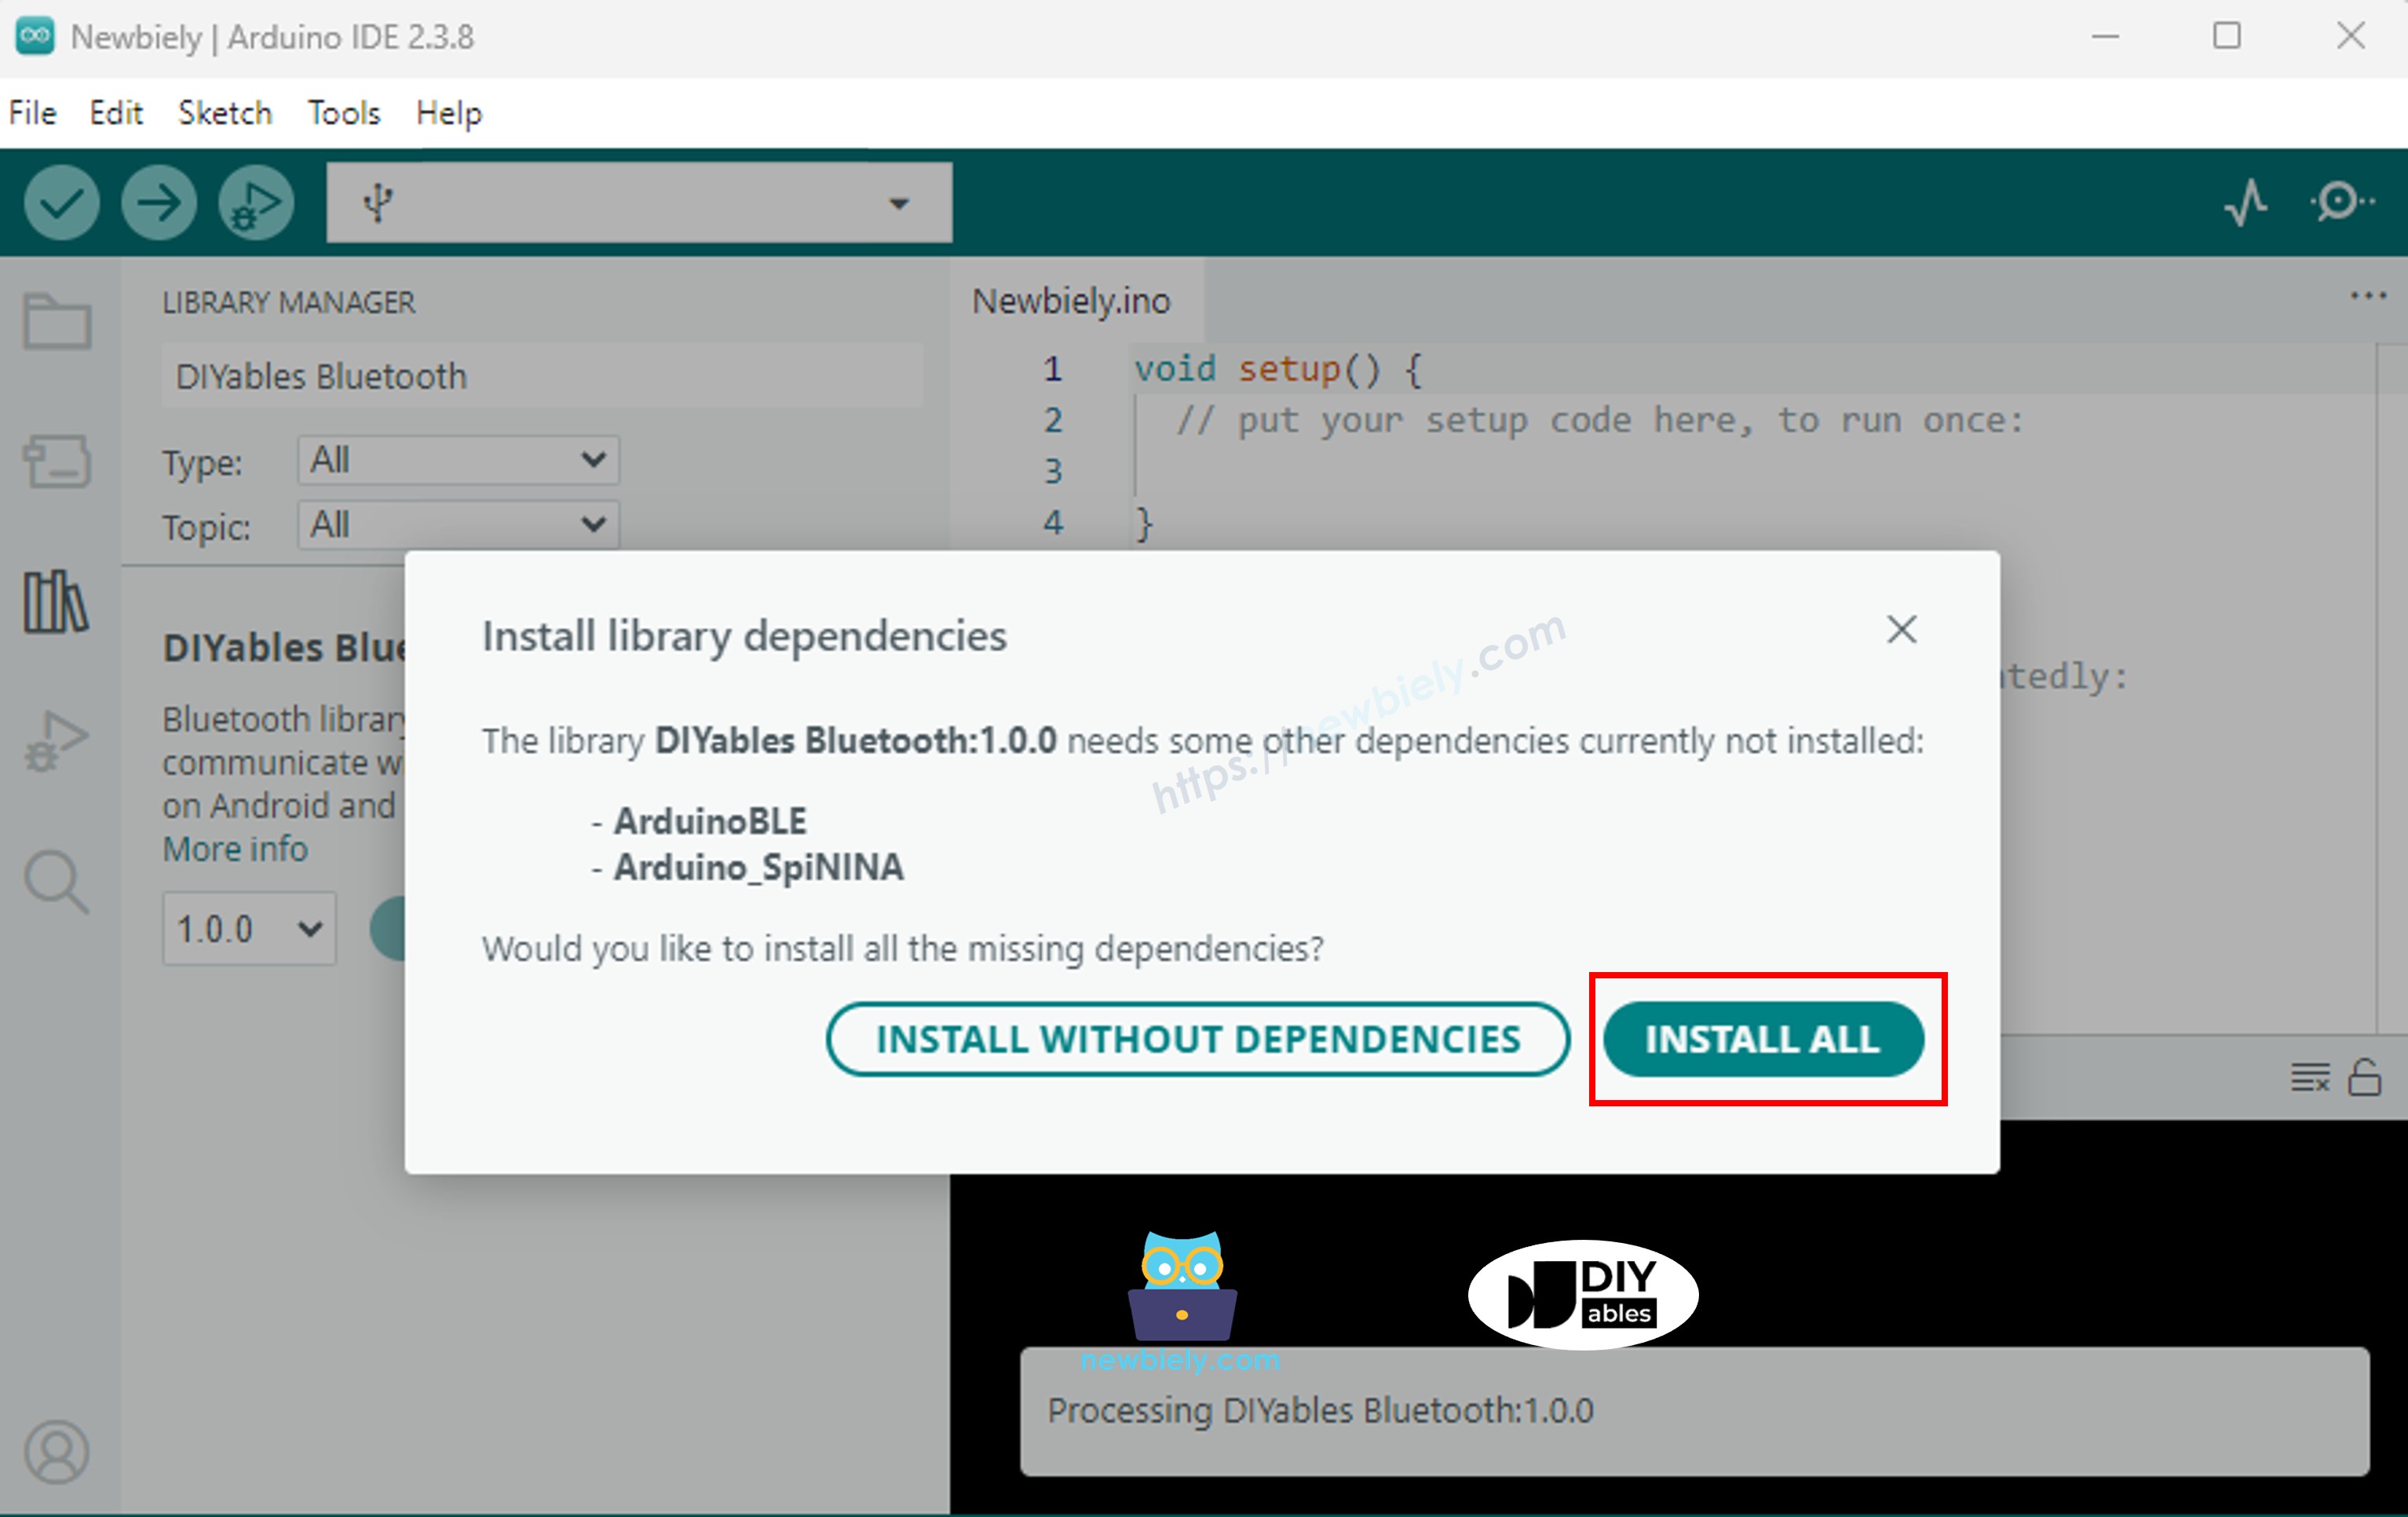
  • When prompted to install dependencies, click Install All.
Arduino Nano ESP32 DIYables Bluetooth dependency

BLE Code

  • In Arduino IDE, open File Examples DIYables Bluetooth ArduinoBLE_Plotter, or paste the code into the editor.
/* * DIYables Bluetooth Library - ESP32 BLE Plotter Example * Works with DIYables Bluetooth STEM app on Android and iOS * * This example demonstrates the Bluetooth Plotter feature: * - Real-time data plotting via Bluetooth * - Plot multiple data series simultaneously * - Configurable plot settings * * Tutorial: https://diyables.io/bluetooth-app * Author: DIYables */ #include <DIYables_BluetoothServer.h> #include <DIYables_BluetoothPlotter.h> #include <platforms/DIYables_Esp32BLE.h> // BLE Configuration const char* DEVICE_NAME = "ESP32BLE_Plotter"; const char* SERVICE_UUID = "19B10000-E8F2-537E-4F6C-D104768A1214"; const char* TX_UUID = "19B10001-E8F2-537E-4F6C-D104768A1214"; const char* RX_UUID = "19B10002-E8F2-537E-4F6C-D104768A1214"; // Create Bluetooth instances DIYables_Esp32BLE bluetooth(DEVICE_NAME, SERVICE_UUID, TX_UUID, RX_UUID); DIYables_BluetoothServer bluetoothServer(bluetooth); // Create Plotter app instance DIYables_BluetoothPlotter bluetoothPlotter; // Variables for generating sample data unsigned long lastPlotTime = 0; const unsigned long PLOT_INTERVAL = 100; float phase = 0; void setup() { Serial.begin(115200); delay(1000); Serial.println("DIYables Bluetooth - ESP32 BLE Plotter Example"); // Initialize Bluetooth server with platform-specific implementation bluetoothServer.begin(); // Add plotter app to server bluetoothServer.addApp(&bluetoothPlotter); // Configure plotter settings bluetoothPlotter.setPlotTitle("Sensor Data"); bluetoothPlotter.setAxisLabels("Time", "Value"); bluetoothPlotter.setYAxisRange(-15, 30); bluetoothPlotter.setMaxSamples(100); bluetoothPlotter.setLegendLabels("Sine", "Cosine", "Tangent"); // Set up connection event callbacks bluetoothServer.setOnConnected([]() { Serial.println("Bluetooth connected!"); }); bluetoothServer.setOnDisconnected([]() { Serial.println("Bluetooth disconnected!"); }); bluetoothPlotter.onDataRequest([]() { Serial.println("App requested plot data"); }); Serial.println("Waiting for Bluetooth connection..."); } void loop() { bluetoothServer.loop(); if (millis() - lastPlotTime >= PLOT_INTERVAL) { lastPlotTime = millis(); float sine = sin(phase); float cosine = cos(phase); float tangent = tan(phase) * 0.3; bluetoothPlotter.send(sine, cosine, tangent); Serial.print(sine, 2); Serial.print(" "); Serial.print(cosine, 2); Serial.print(" "); Serial.println(tangent, 2); phase += 0.1; if (phase > 2 * PI) { phase = 0; } } delay(10); }
  • Click Upload to flash the sketch to the board.
  • Open the Serial Monitor.
  • The Serial Monitor output should look like:
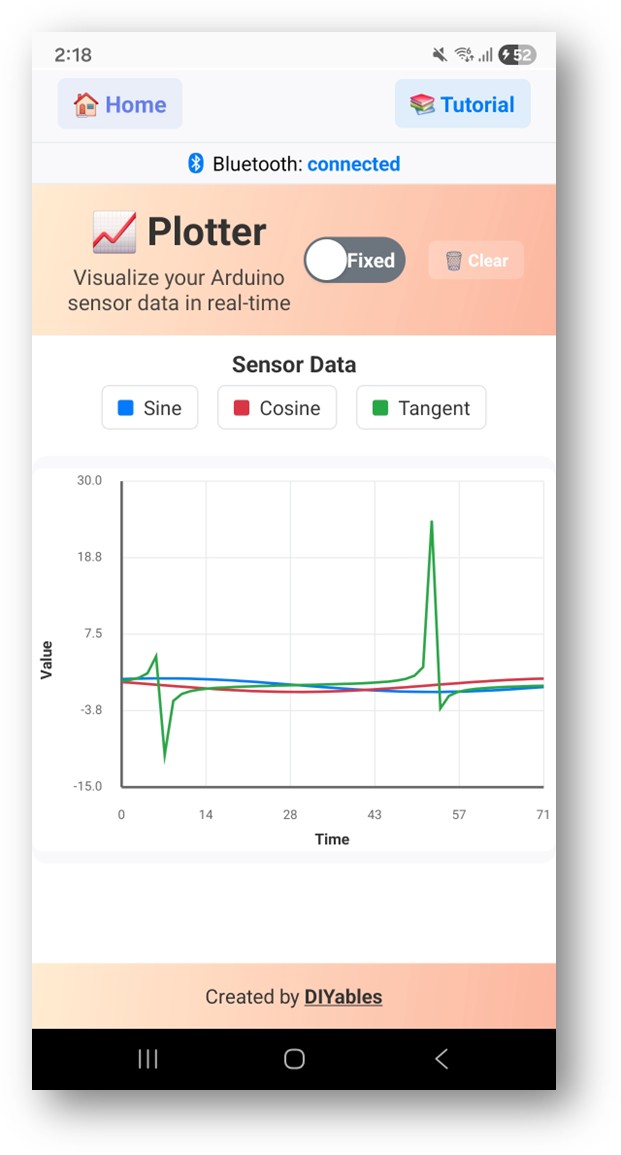
COM6
Send
DIYables Bluetooth - Plotter Example Waiting for Bluetooth connection...
Autoscroll Show timestamp
Clear output
9600 baud  
Newline  

Mobile App

  • Install the DIYables Bluetooth App on your smartphone: Android | iOS

Note: The DIYables Bluetooth App works on both Android and iOS with BLE. No manual pairing is required.

  • Launch the DIYables Bluetooth App.
  • On first launch, grant the following permissions:
    • Nearby Devices (Android 12+) / Bluetooth (iOS) — required to scan and connect to Bluetooth devices
    • Location (Android 11 and below only) — required by older Android versions to scan for BLE
  • Ensure Bluetooth is enabled on your device.
  • Tap Connect on the home screen. The app will scan for BLE devices.
DIYables Bluetooth App - Home Screen with Scan Button
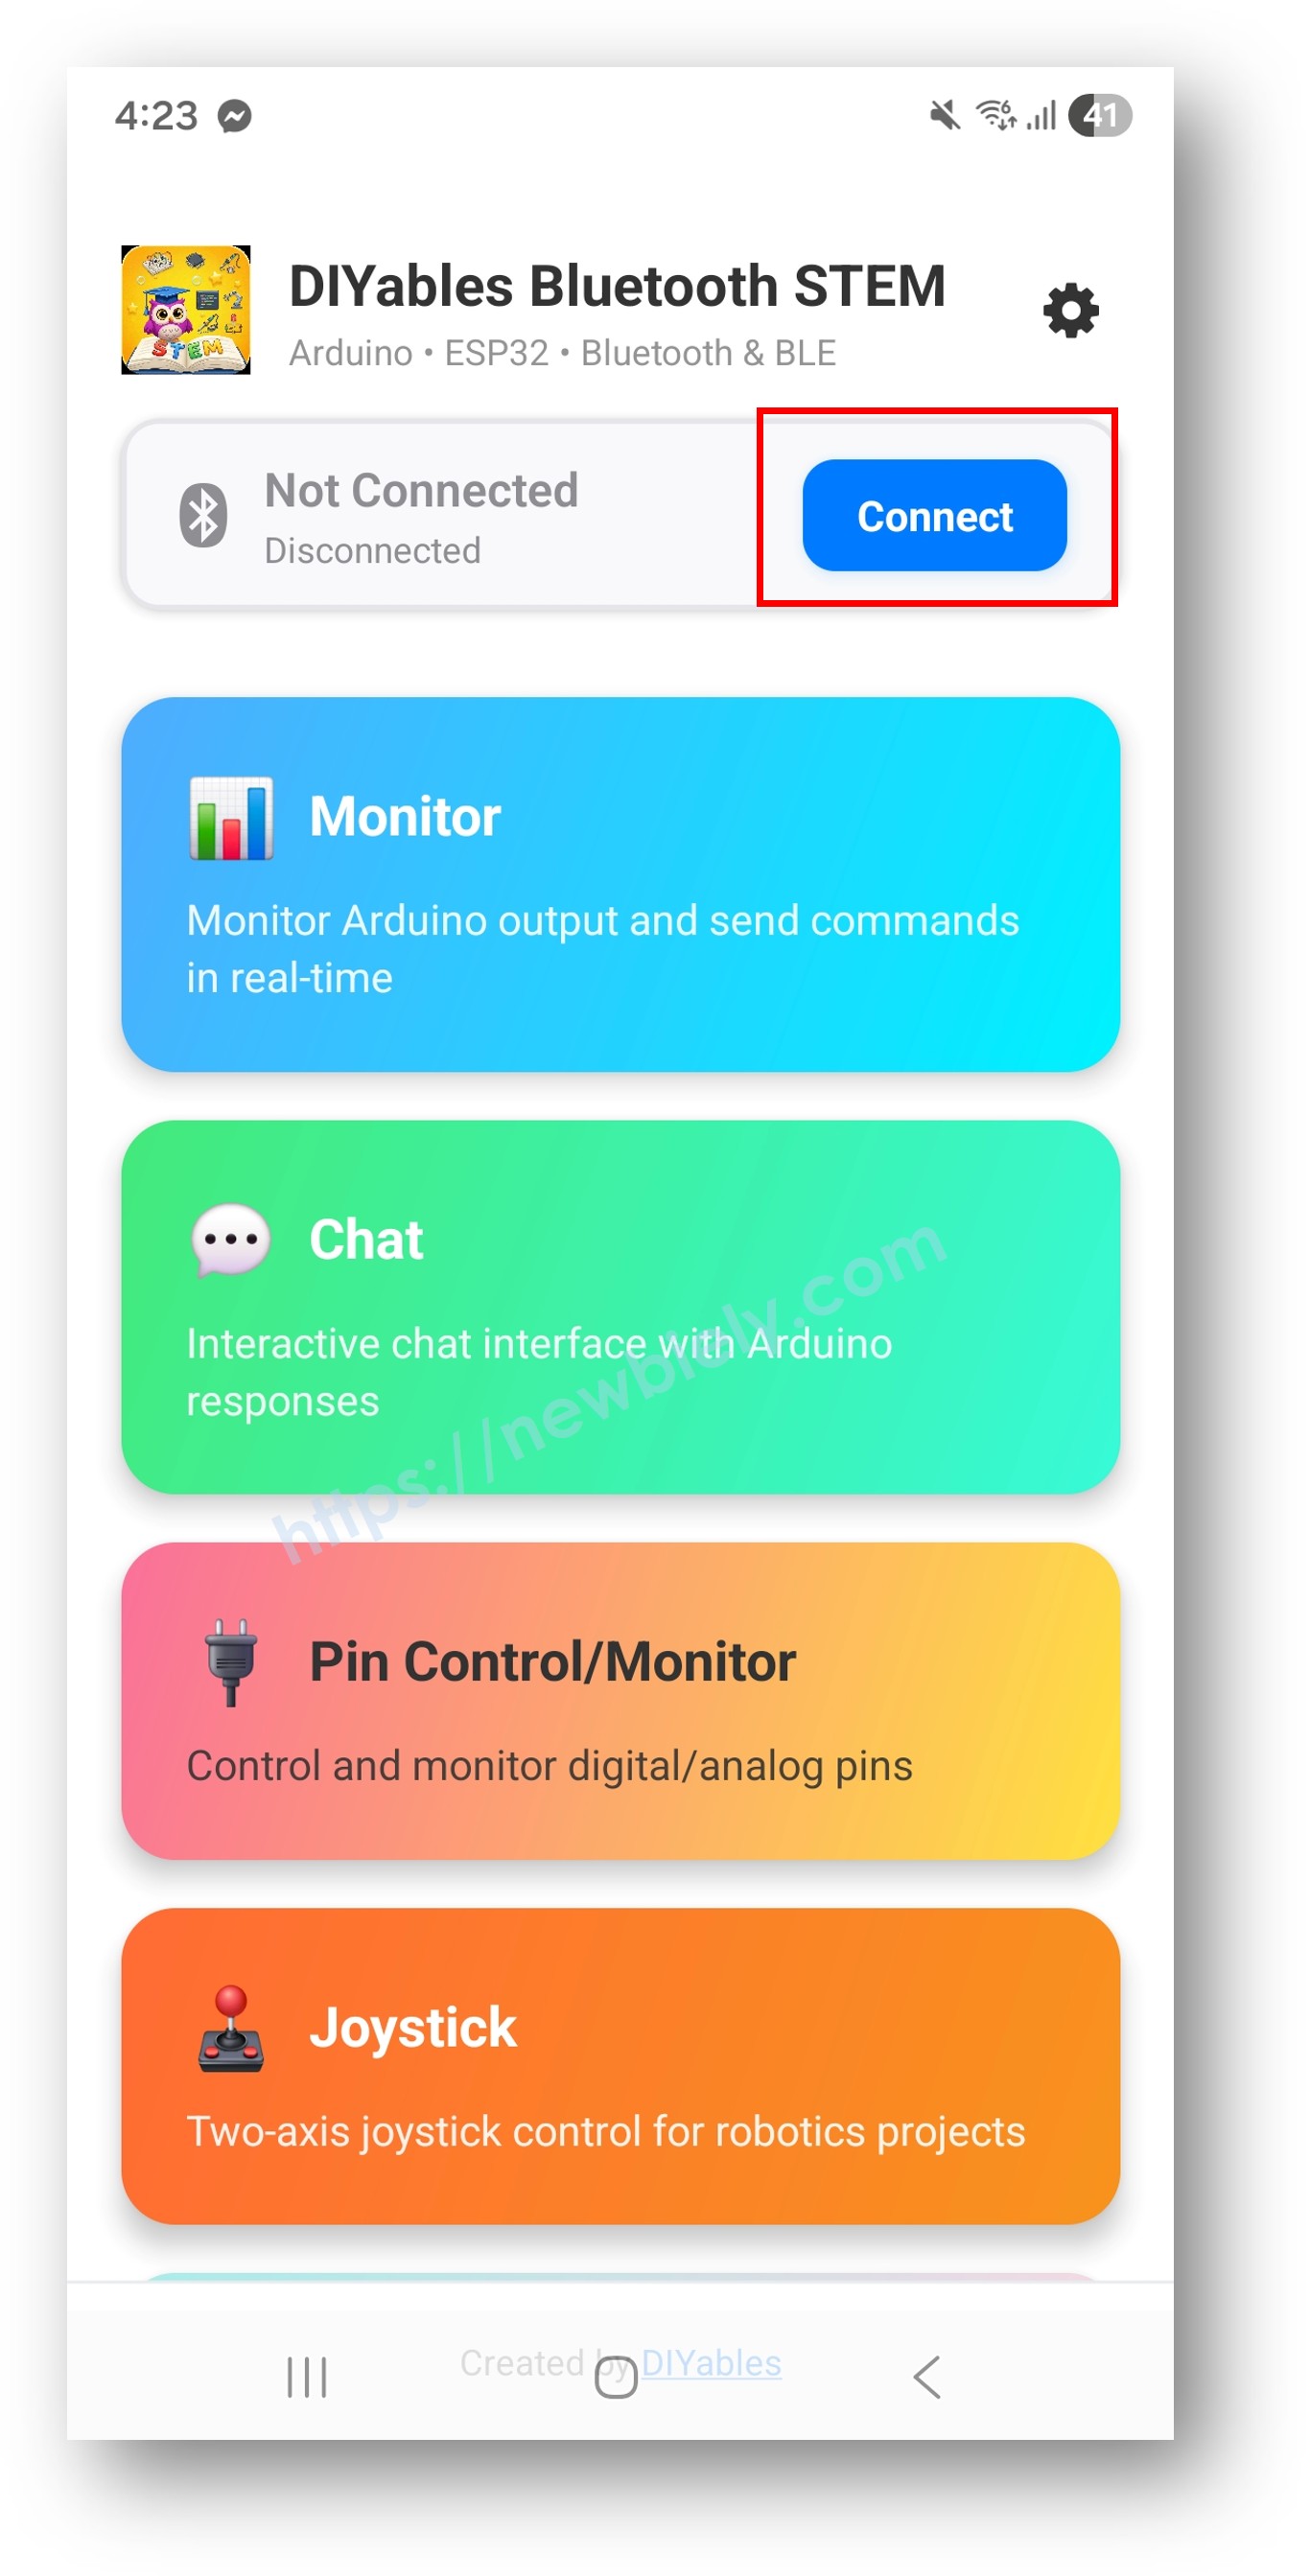
  • Tap "Arduino_Plotter" in the scan results.
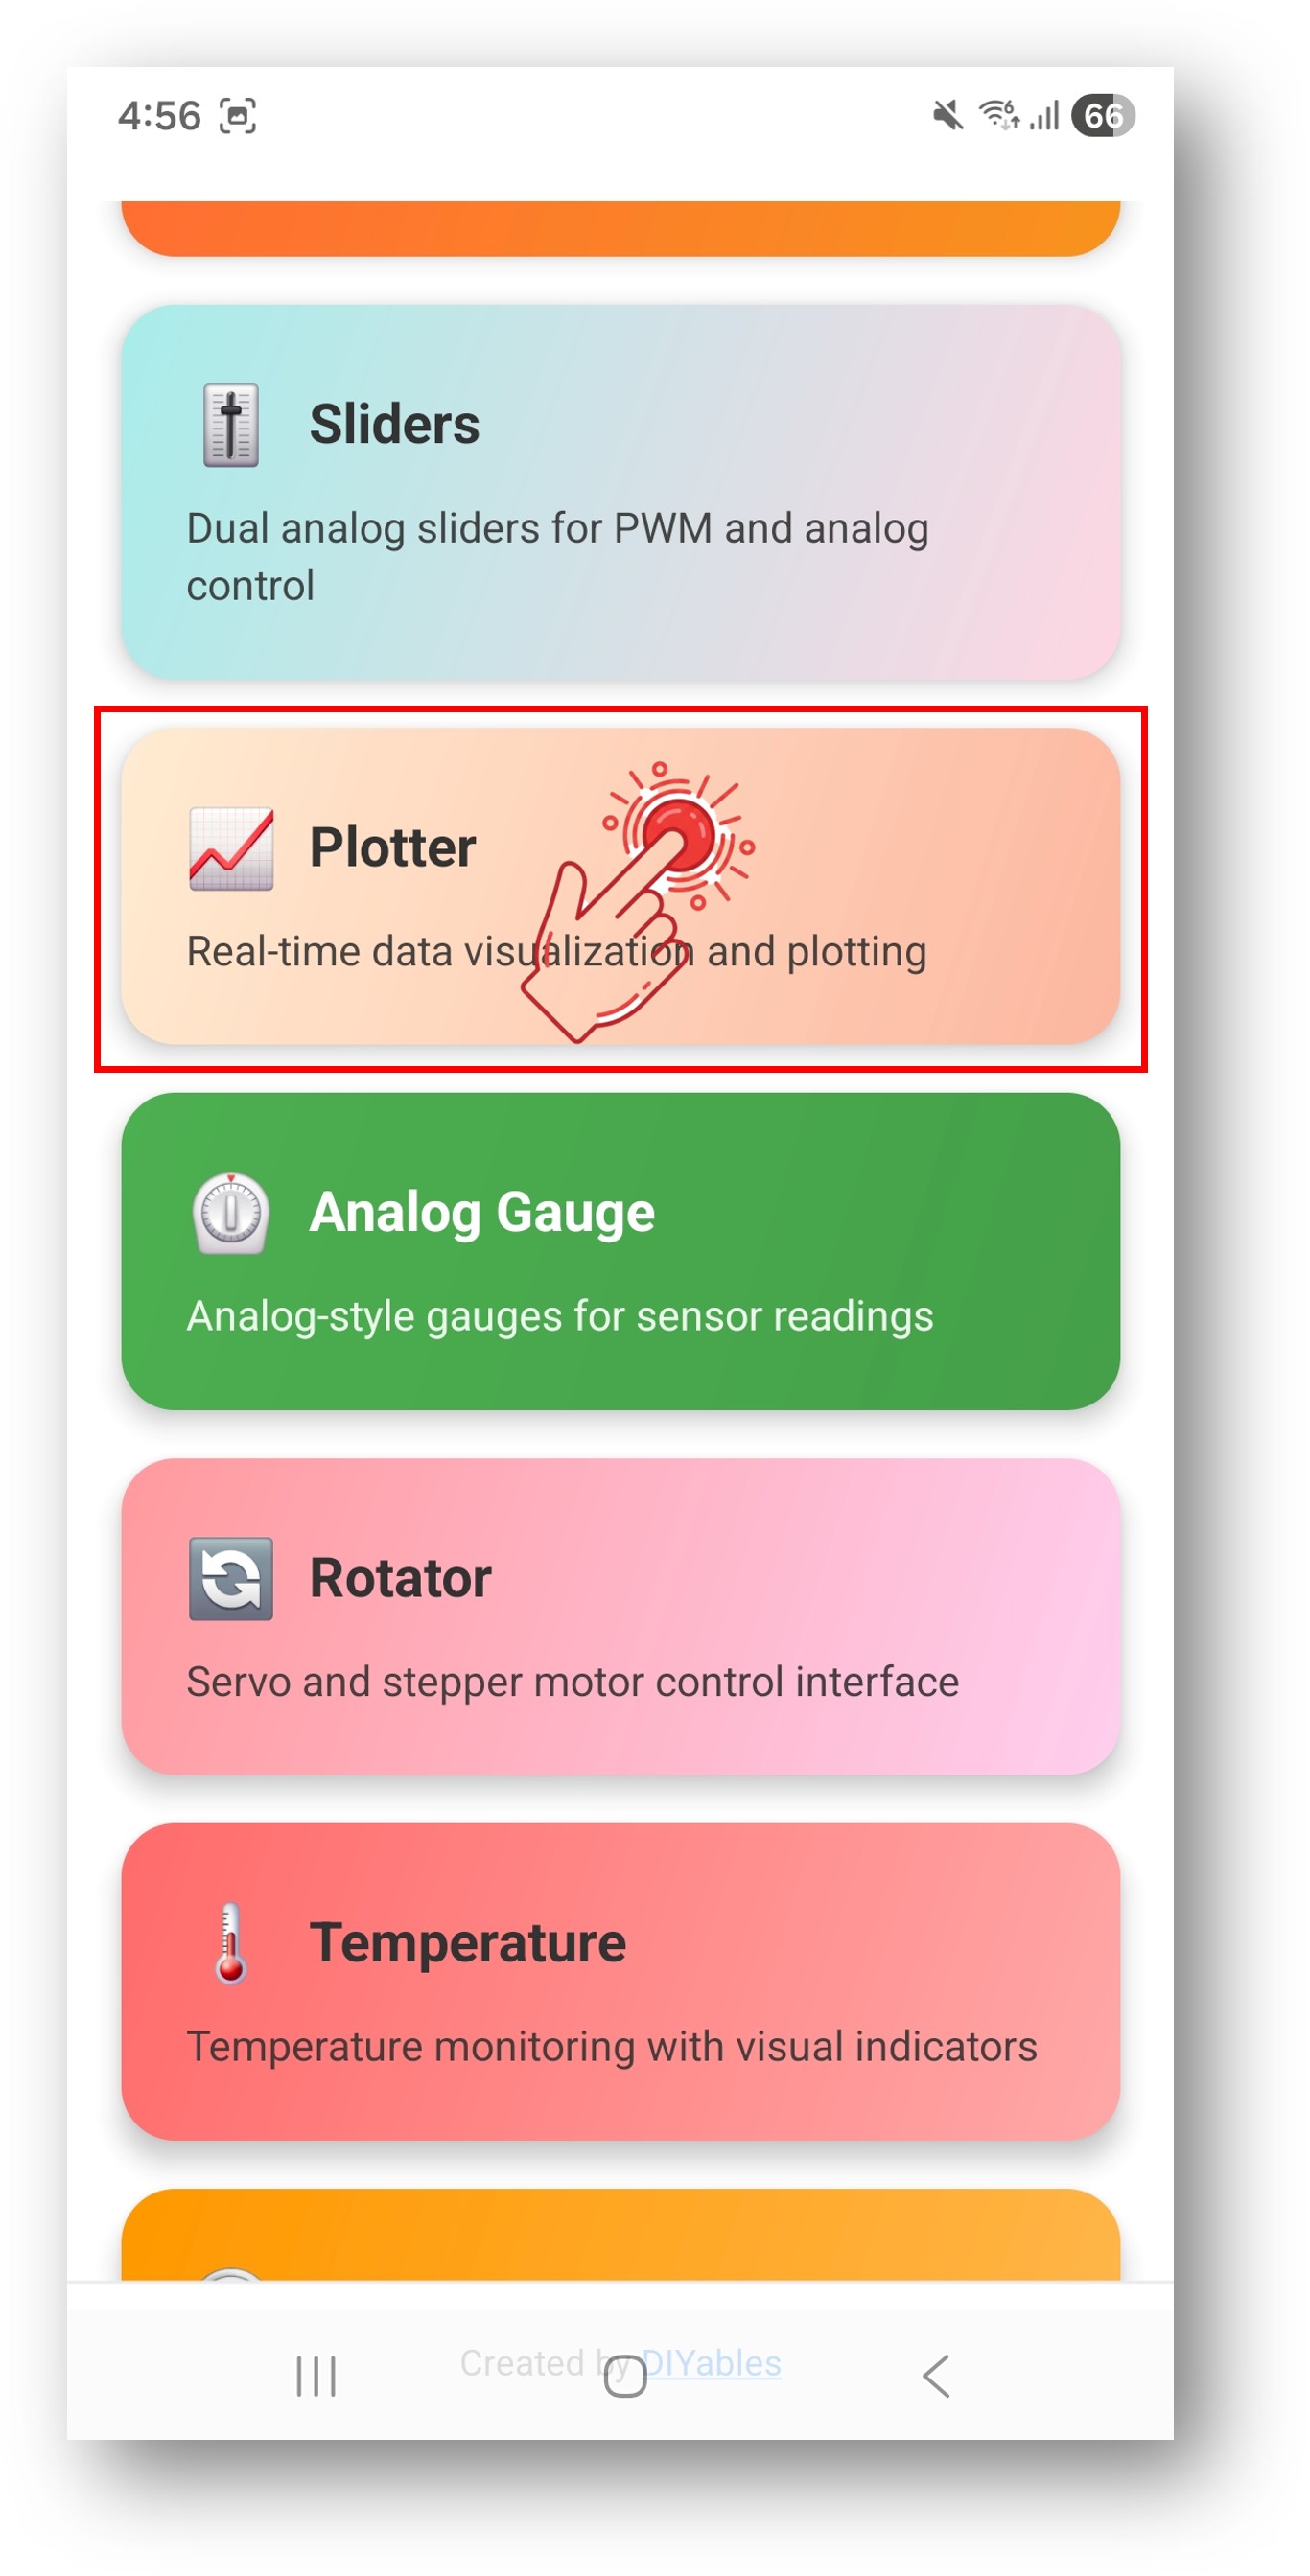
  • After connecting, return to the home screen and open the Plotter app.
DIYables Bluetooth App - Home Screen with Plotter App

Tap the settings icon on the home screen to show or hide apps. See the DIYables Bluetooth App User Manual for details.

  • A real-time plot of Sine, Cosine, and Tangent waveforms will appear.
DIYables Bluetooth App - Plotter Screen

Now look back at the Serial Monitor on Arduino IDE. You will see:

COM6
Send
Bluetooth connected! Sending plot data... Sine: 0.00, Cosine: 10.00, Tangent: 0.00
Autoscroll Show timestamp
Clear output
9600 baud  
Newline  

Creative Customization - Adapt the Code to Your Project

Configure Plot Appearance

// Set plot title bluetoothPlotter.setPlotTitle("My Sensor Data"); // Set axis labels bluetoothPlotter.setAxisLabels("Time", "Value"); // Set Y-axis range bluetoothPlotter.setYAxisRange(-100, 100); // Set maximum samples to display bluetoothPlotter.setMaxSamples(200); // Set legend labels for each channel bluetoothPlotter.setLegendLabels("Temperature", "Humidity", "Pressure");

Send Data Points

// Send a single value bluetoothPlotter.send(sensorValue); // Send two values bluetoothPlotter.send(temperature, humidity); // Send three values bluetoothPlotter.send(value1, value2, value3); // Send up to six values bluetoothPlotter.send(ch1, ch2, ch3, ch4, ch5, ch6);

Handle Data Request

bluetoothPlotter.onDataRequest([]() { Serial.println("App requested data"); // App just connected or needs initial config });

Programming Examples

Temperature and Humidity Logger

DIYables_BluetoothPlotter bluetoothPlotter(bluetoothServer); void setup() { bluetoothPlotter.setPlotTitle("Environment Monitor"); bluetoothPlotter.setAxisLabels("Time", "Value"); bluetoothPlotter.setYAxisRange(0, 100); bluetoothPlotter.setMaxSamples(100); bluetoothPlotter.setLegendLabels("Temp (°C)", "Humidity (%)"); } void loop() { bluetoothServer.loop(); static unsigned long lastTime = 0; if (millis() - lastTime >= 1000) { lastTime = millis(); float temp = readTemperature(); float humidity = readHumidity(); bluetoothPlotter.send(temp, humidity); } }

Analog Input Plotter

void loop() { bluetoothServer.loop(); static unsigned long lastTime = 0; if (millis() - lastTime >= 100) { lastTime = millis(); int a0 = analogRead(A0); int a1 = analogRead(A1); int a2 = analogRead(A2); bluetoothPlotter.send(a0, a1, a2); } }

Troubleshooting

Common Issues

1. Device not visible in the app

  • Confirm the board is powered on and the sketch is uploaded
  • Verify Bluetooth is enabled on your phone
  • On Android 11 and below, enable Location services as well

2. Plot not updating

  • Verify data is sent inside loop()
  • Confirm bluetoothServer.loop() is called
  • Ensure the app is on the Plotter screen

3. Data looks incorrect or noisy

  • Check sensor wiring and readings
  • Confirm the Y-axis range matches your data range
  • Consider applying smoothing or filtering to the data

4. Plot title or labels not appearing

  • Set the plot configuration in setup() before a connection is made
  • Use the onDataRequest callback to re-send configuration when needed

5. Upload fails or board not recognized

  • Install the latest Arduino Nano ESP32 board package via Board Manager
  • Try a different USB cable or port

Project Ideas

  • Environmental monitoring (temperature, humidity, pressure)
  • Accelerometer/gyroscope data visualization
  • Analog sensor calibration tool
  • Signal analysis and comparison
  • Science experiment data logger

Next Steps

After completing the Bluetooth Plotter example, explore:

  1. Bluetooth Table — Structured data display
  2. Bluetooth Monitor — Text-based data output
  3. Bluetooth Temperature — Gauge-style temperature display
  4. Multiple Bluetooth Apps — Combine plotter with other app widgets

Support

For additional help:

※ OUR MESSAGES

  • As freelancers, We are AVAILABLE for HIRE. See how to outsource your project to us
  • Please feel free to share the link of this tutorial. However, Please do not use our content on any other websites. We invested a lot of effort and time to create the content, please respect our work!