Arduino Nano ESP32 - Web Apps Web Plotter
Overview
This tutorial covers the DIYablesWebPlotterPage class from the DIYables ESP32 WebApps Library. The page renders a streaming line chart in the browser. The Arduino Nano ESP32 sketch sends data points over WebSocket; the browser appends each point to the corresponding series in real time. Up to 8 independent data series are supported simultaneously.
Watch this step-by-step video tutorial demonstrating how to use a DHT sensor with the Web Plotter app:
What This Tutorial Covers
- Configuring the plotter title, axis labels, and sample retention limit
- Sending named data points from the sketch using addDataPoint()
- Plotting multiple series simultaneously
- Replacing simulated data with real sensor readings
Hardware Preparation
Or you can buy the following kits:
| 1 | × | DIYables Sensor Kit (18 sensors/displays) |
Additionally, some of these links are for products from our own brand, DIYables .
Steps
Follow these instructions step by step:
- If this is your first time using the Arduino Nano ESP32, refer to the tutorial on setting up the Arduino Nano ESP32 development environment.
- Connect the Arduino Nano ESP32 board to your computer using a USB cable.
- Launch the Arduino IDE on your computer.
- Select the appropriate board (e.g. Arduino Nano ESP32) and COM port.
- Navigate to the Libraries icon on the left bar of the Arduino IDE.
- Search "DIYables ESP32 WebApps", then find the DIYables ESP32 WebApps Library by DIYables
- Click Install button to install the library.
- Search for DIYables ESP32 WebApps created by DIYables and click the Install button.
- You will be asked for installing some other library dependencies
- Click Install All button to install all library dependencies.
- On Arduino IDE, Go to File Examples DIYables ESP32 WebApps WebPlotter example, or copy the above code and paste it to the editor of Arduino IDE
- Update the WiFi credentials in the sketch:
- Click Upload button on Arduino IDE to upload code to Arduino Nano ESP32
- Open the Serial Monitor
- The Serial Monitor output should resemble the following:
- If nothing appears, press the reset button on the board.
- Enter the IP address from the Serial Monitor into a browser on the same network.
- Example: http://192.168.0.2
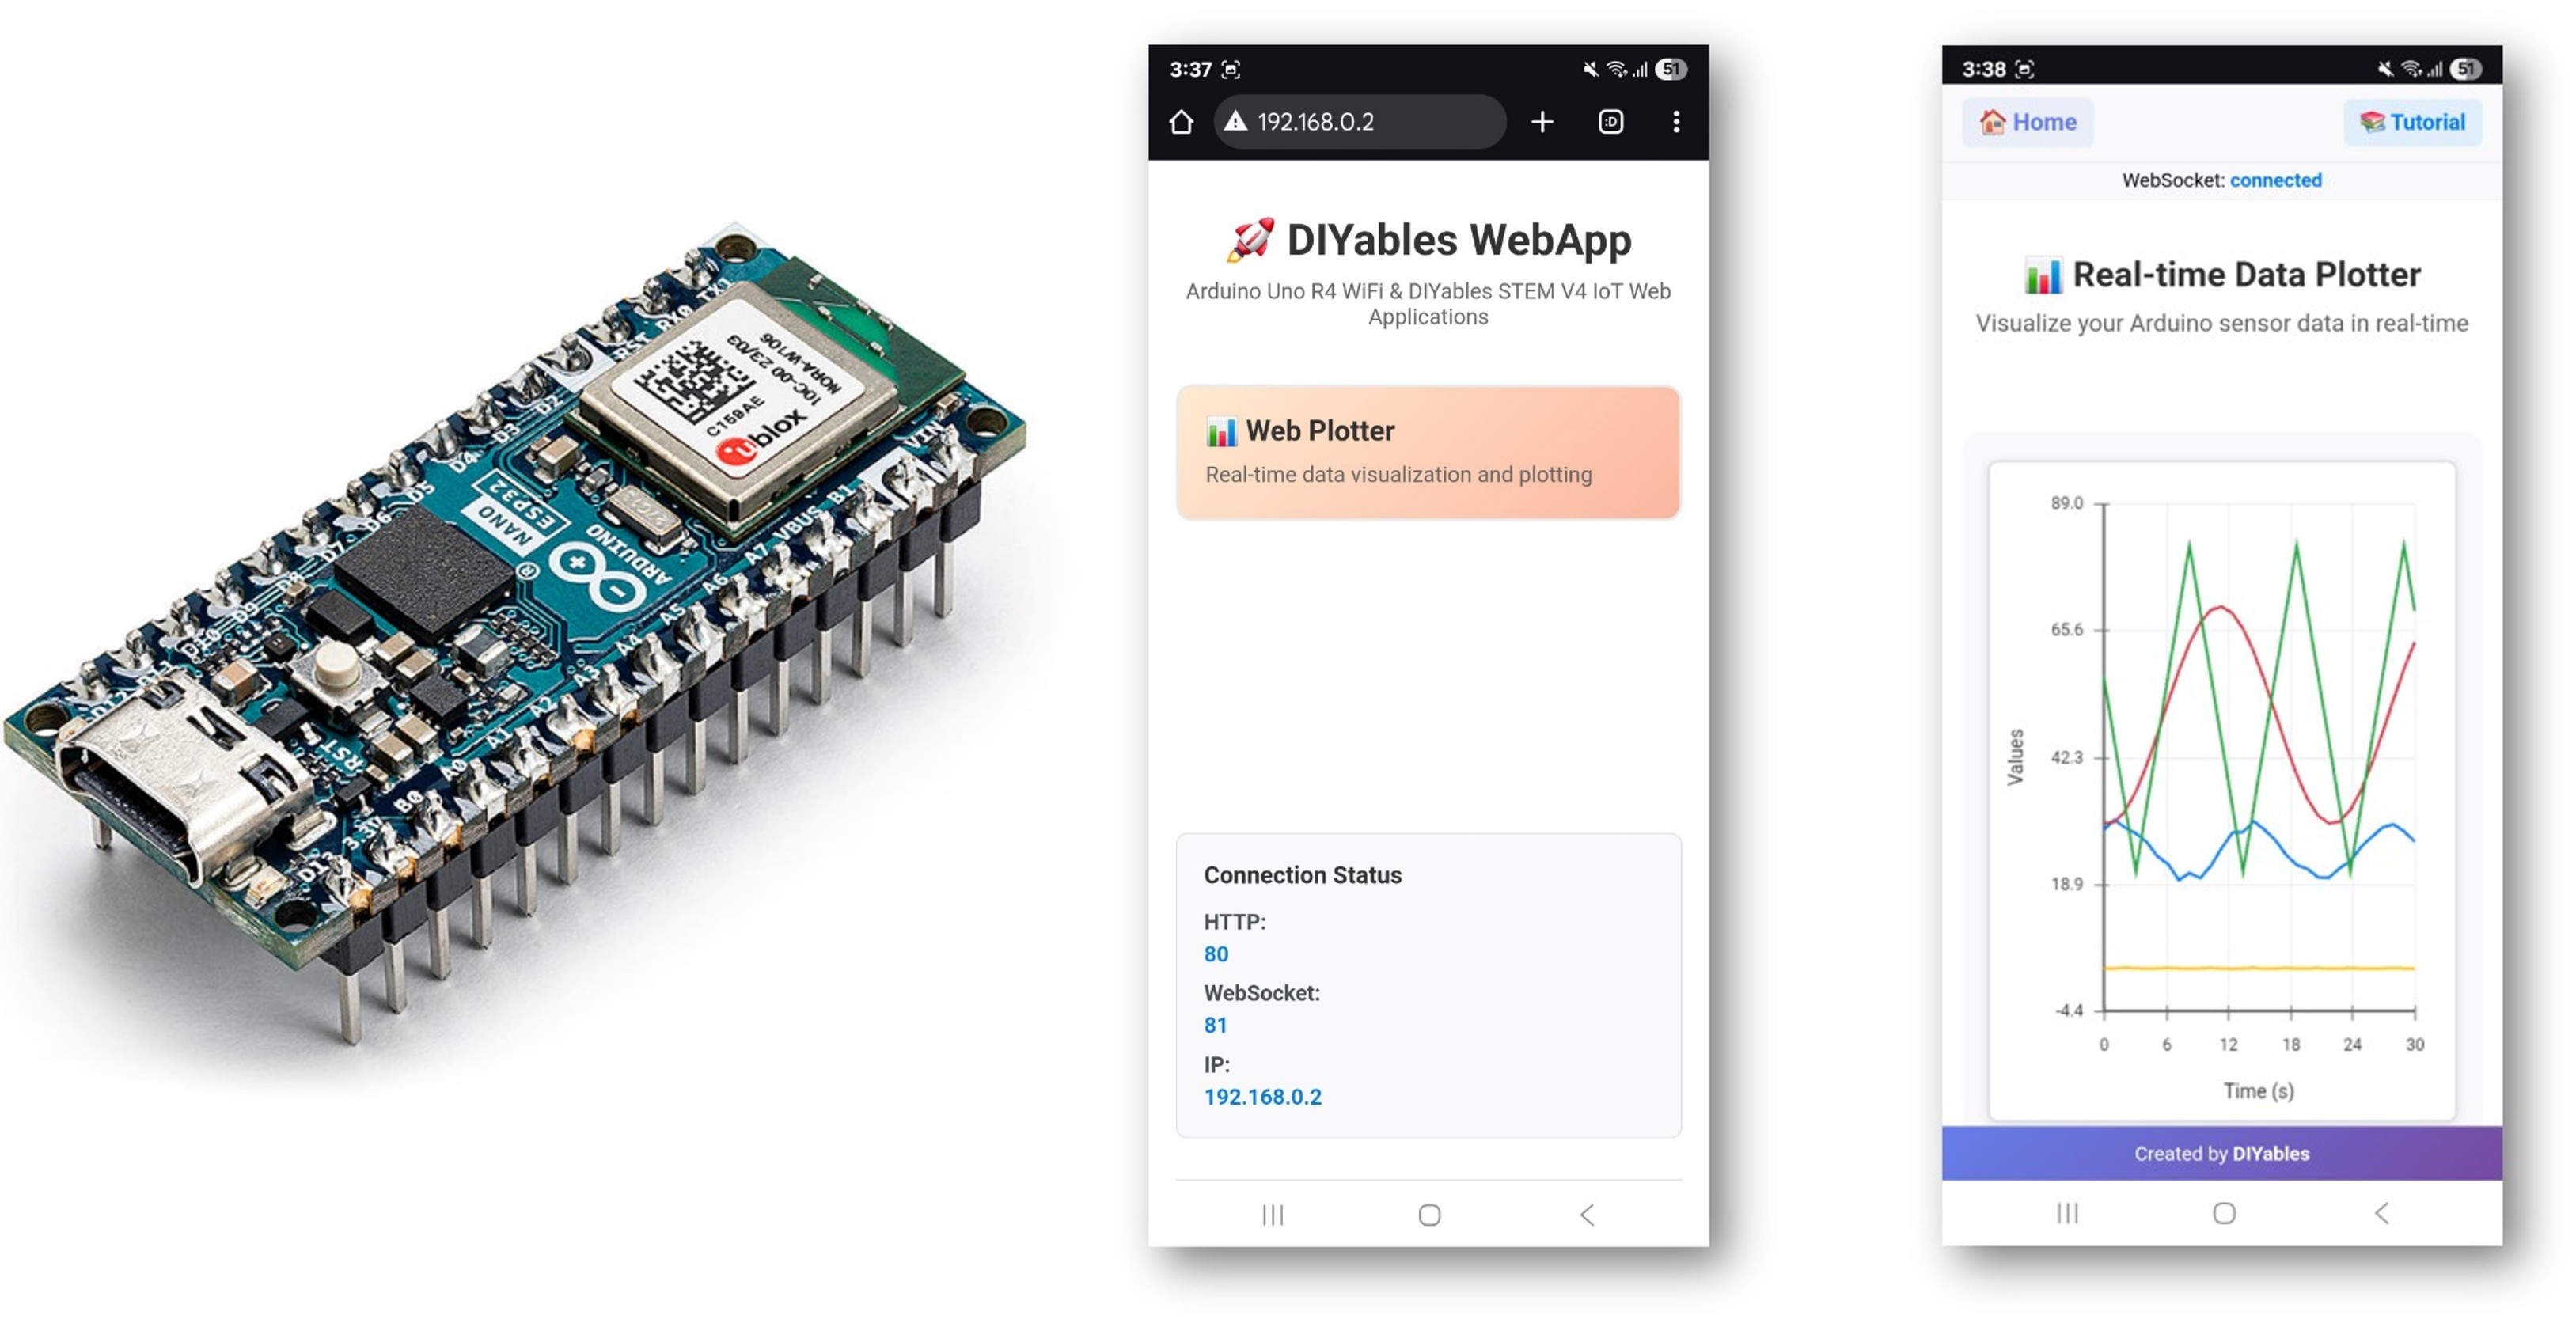
- The home page shows a card for the plotter application:
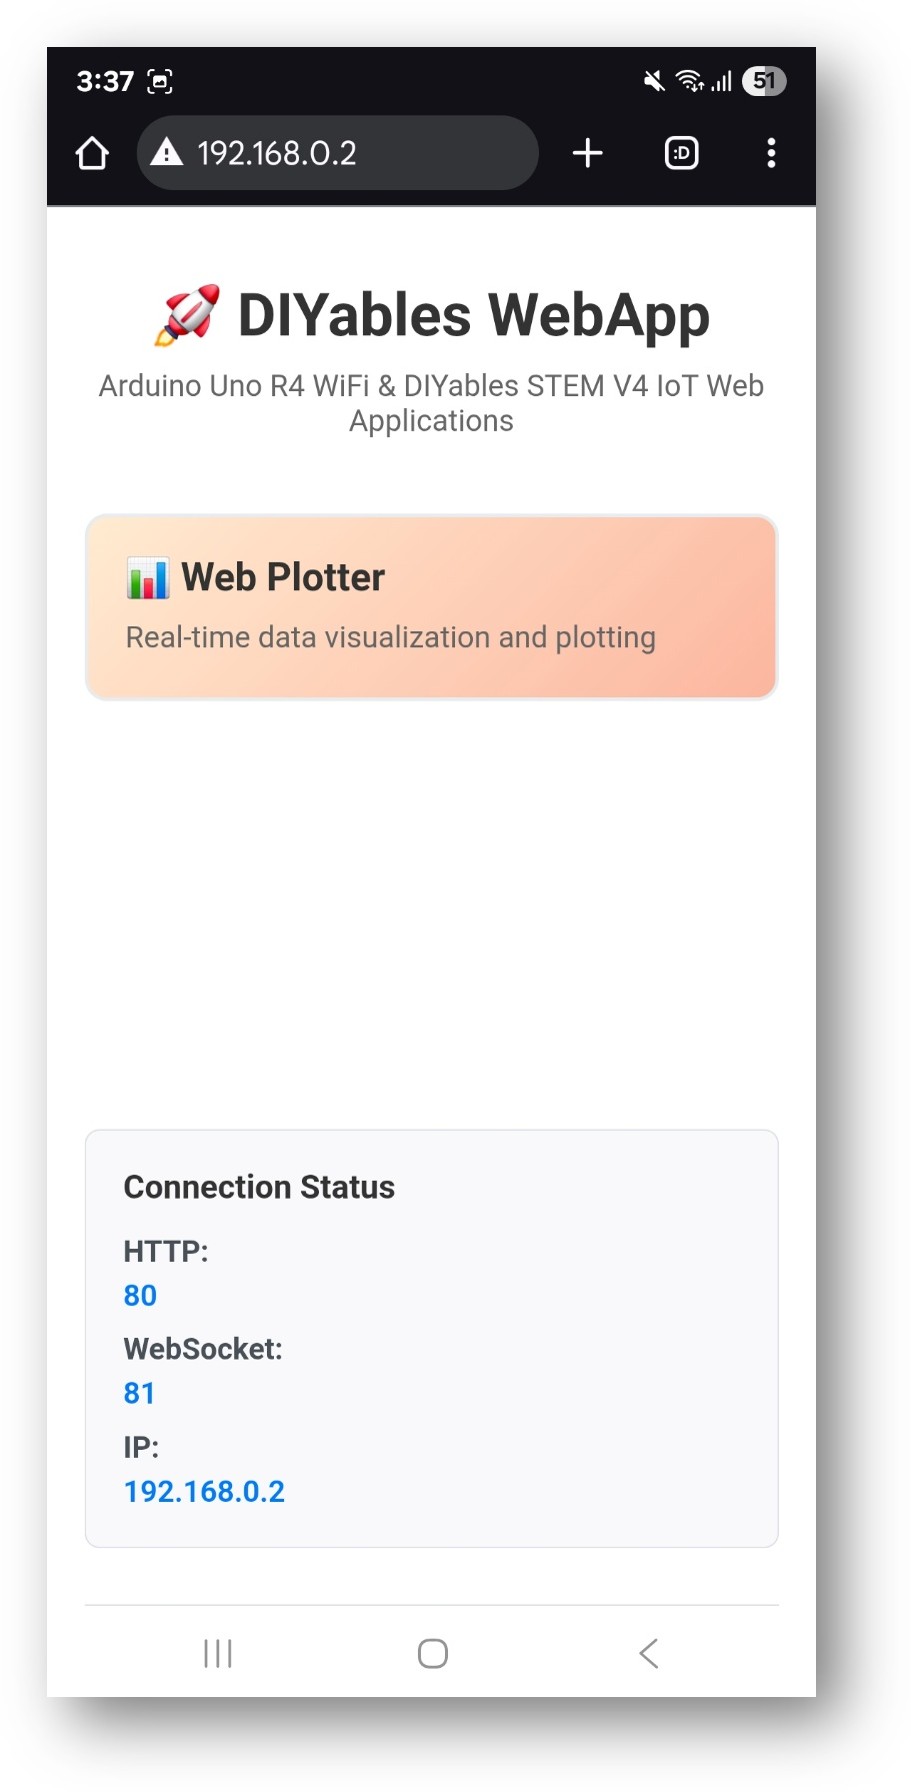
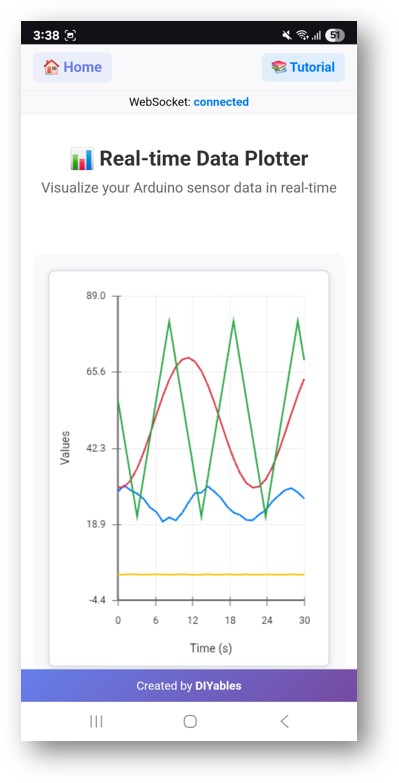
- Select the Web Plotter card to open the chart page:
- The page is also directly accessible at http://192.168.0.2/web-plotter.
- The chart begins updating as the sketch sends simulated data. Each series is drawn in a distinct color.
Plotter Configuration
Set the chart title, axis labels, auto-scale behavior, and maximum retained samples before starting the server:
Sending Data Points
Each data point specifies a series name, X value, and Y value. The series is created automatically on first use:
Reading from Real Sensors
Replace the simulated values in the example with actual sensor readings:
Single Sensor
Multiple Sensors
Limit the send rate to avoid overwhelming the WebSocket connection. A 500 ms to 1000 ms interval is suitable for most sensor applications.
Troubleshooting
Chart does not update
- Confirm webAppsServer.loop() runs on every loop() iteration
- Add Serial.println() before addDataPoint() to verify the code path executes
- Reload the browser page and check the WebSocket connection indicator
Chart shows flat lines or wrong values
- Verify the sensor read and scaling formula
- Print the value to the Serial Monitor alongside sending it to the plotter
Too many data points slow the browser
- Lower setMaxSamples() to reduce the points retained per series
- Increase the delay between data sends
Board not reachable
- Confirm the IP address from the Serial Monitor
- Ensure the browser device is on the same 2.4 GHz network as the board