Arduino Nano - TCS3200D/TCS230 Color Sensor
This comprehensive guide shows you how to connect the TCS3200D/TCS230 color sensor to Arduino Nano for precise color measurement and RGB value extraction. Master calibration procedures and develop color recognition capabilities in your projects.
Learning objectives:
- Establishing connections between TCS3200D/TCS230 and Arduino Nano
- Executing sensor calibration to eliminate environmental noise
- Developing Arduino Nano programs for RGB color measurement
Hardware Preparation
Or you can buy the following kits:
| 1 | × | DIYables Sensor Kit (18 sensors/displays) |
Additionally, some of these links are for products from our own brand, DIYables .
Overview of TCS3200D/TCS230 Color Sensor
The TCS3200D/TCS230 sensor utilizes a photodiode matrix arranged in an 8×8 grid for color detection through optical filtering. Within this 64-element array, 16 photodiodes feature red spectral filters, another 16 use green filters, 16 employ blue filters, and the remaining 16 operate without filters (clear response). Color measurement happens by activating specific filter sets and analyzing the resulting frequency-modulated square-wave output.
Built-in white LED arrays on typical modules deliver constant illumination to targets, maintaining reading stability regardless of external lighting variations and enhancing performance in dim environments.
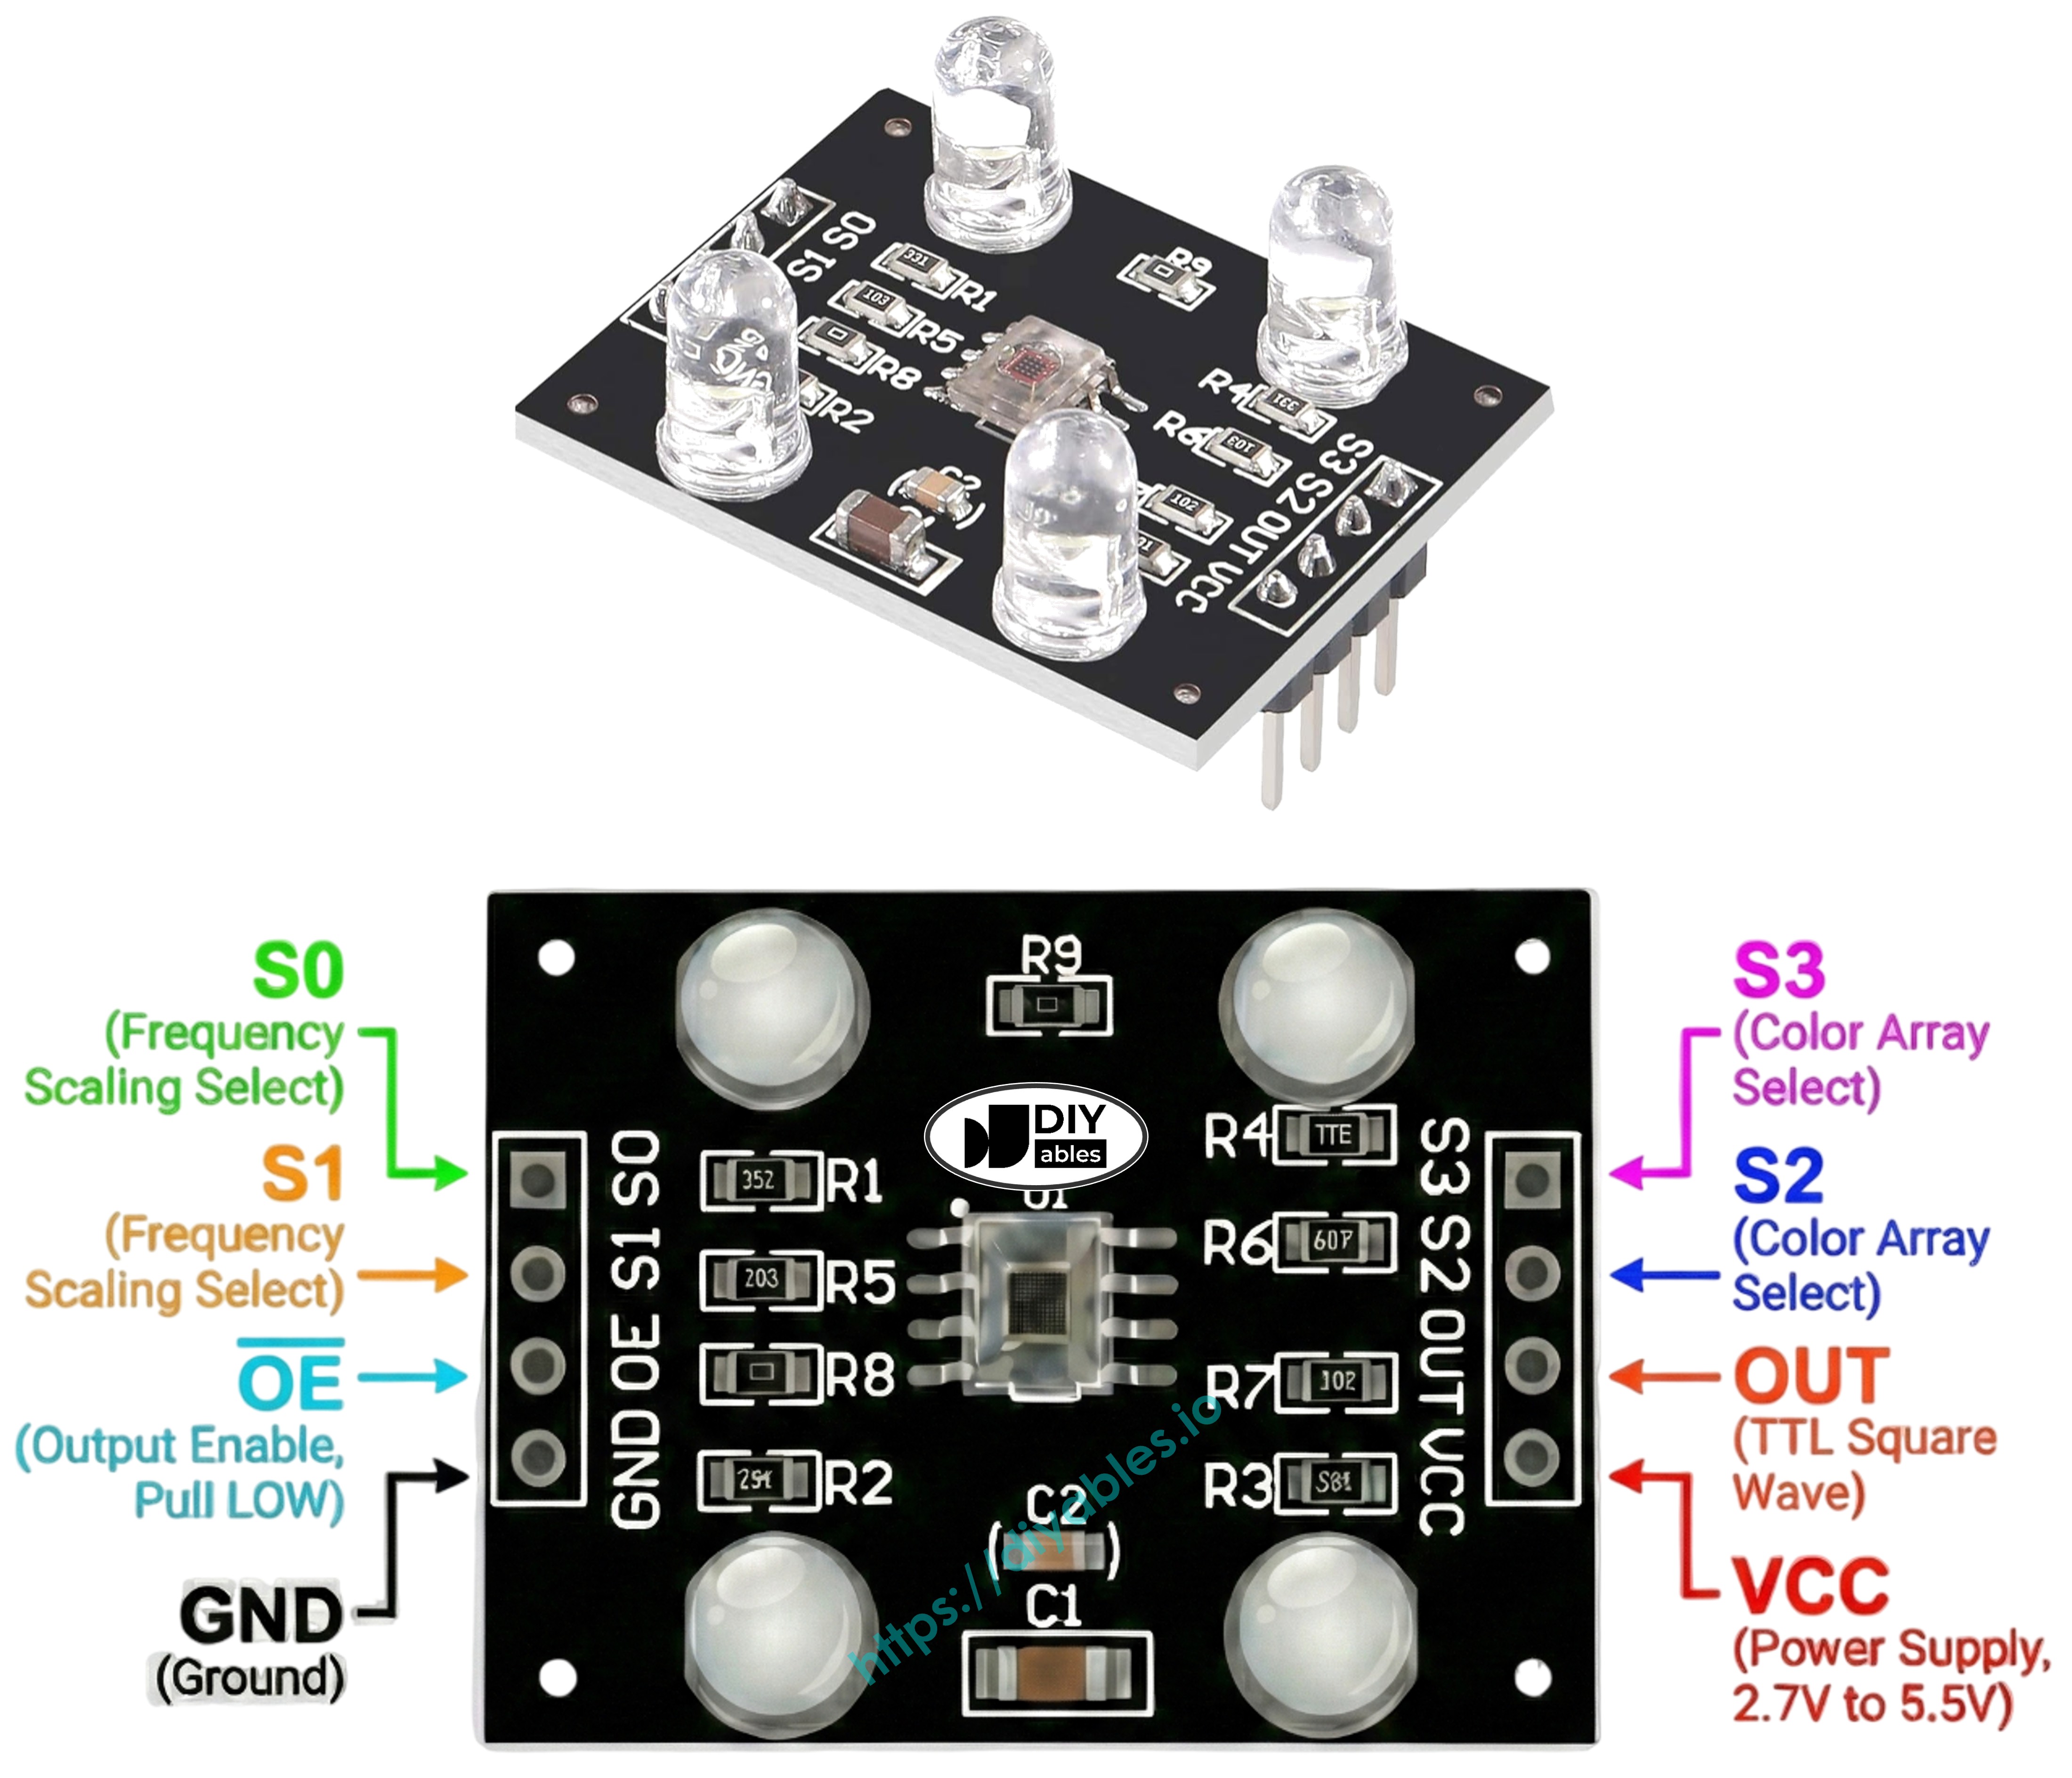
Pinout
Available connections on the TCS3200D/TCS230 sensor board:
- VCC pin: Supply voltage input (+5V).
- GND pin: Ground reference (0V).
- S0, S1 pins: Output frequency scaling selectors.
- S2, S3 pins: Color channel filter selectors.
- OUT pin: Frequency-modulated square wave output.
- OE pin: Output enable input (enables when LOW). Standard modules typically hard-wire this to GND internally. If not connected, manually wire to GND.
How It Works
Two critical settings control sensor behavior: which color channel to activate and what output signal strength to generate. Two pairs of control inputs manage these functions:
Frequency scaling control (S0 and S1 pins):
- S0=LOW, S1=LOW: Power down state
- S0=LOW, S1=HIGH: 2% scaling factor
- S0=HIGH, S1=LOW: 20% scaling factor
- S0=HIGH, S1=HIGH: 100% scaling factor (full speed)
Color channel selection (S2 and S3 pins):
- S2=LOW, S3=LOW: Red photodiodes active
- S2=LOW, S3=HIGH: Blue photodiodes active
- S2=HIGH, S3=LOW: Clear photodiodes active (no filtering)
- S2=HIGH, S3=HIGH: Green photodiodes active
The OUT pin delivers square-wave frequencies spanning approximately 2 Hz to 500 kHz range. Frequency increases with light intensity—brighter illumination produces higher frequency output. The pulseIn() function measures pulse duration, which correlates inversely—shorter durations indicate stronger light. Calibrated measurements translate into conventional 0-255 RGB format.
Achieving Optimal Precision
- Keep sensor positioned 1-3 cm from measurement target with stable angular alignment.
- Utilize integrated white LED illumination for repeatable lighting.
- Shield sensor from variable ambient light to enhance measurement consistency.
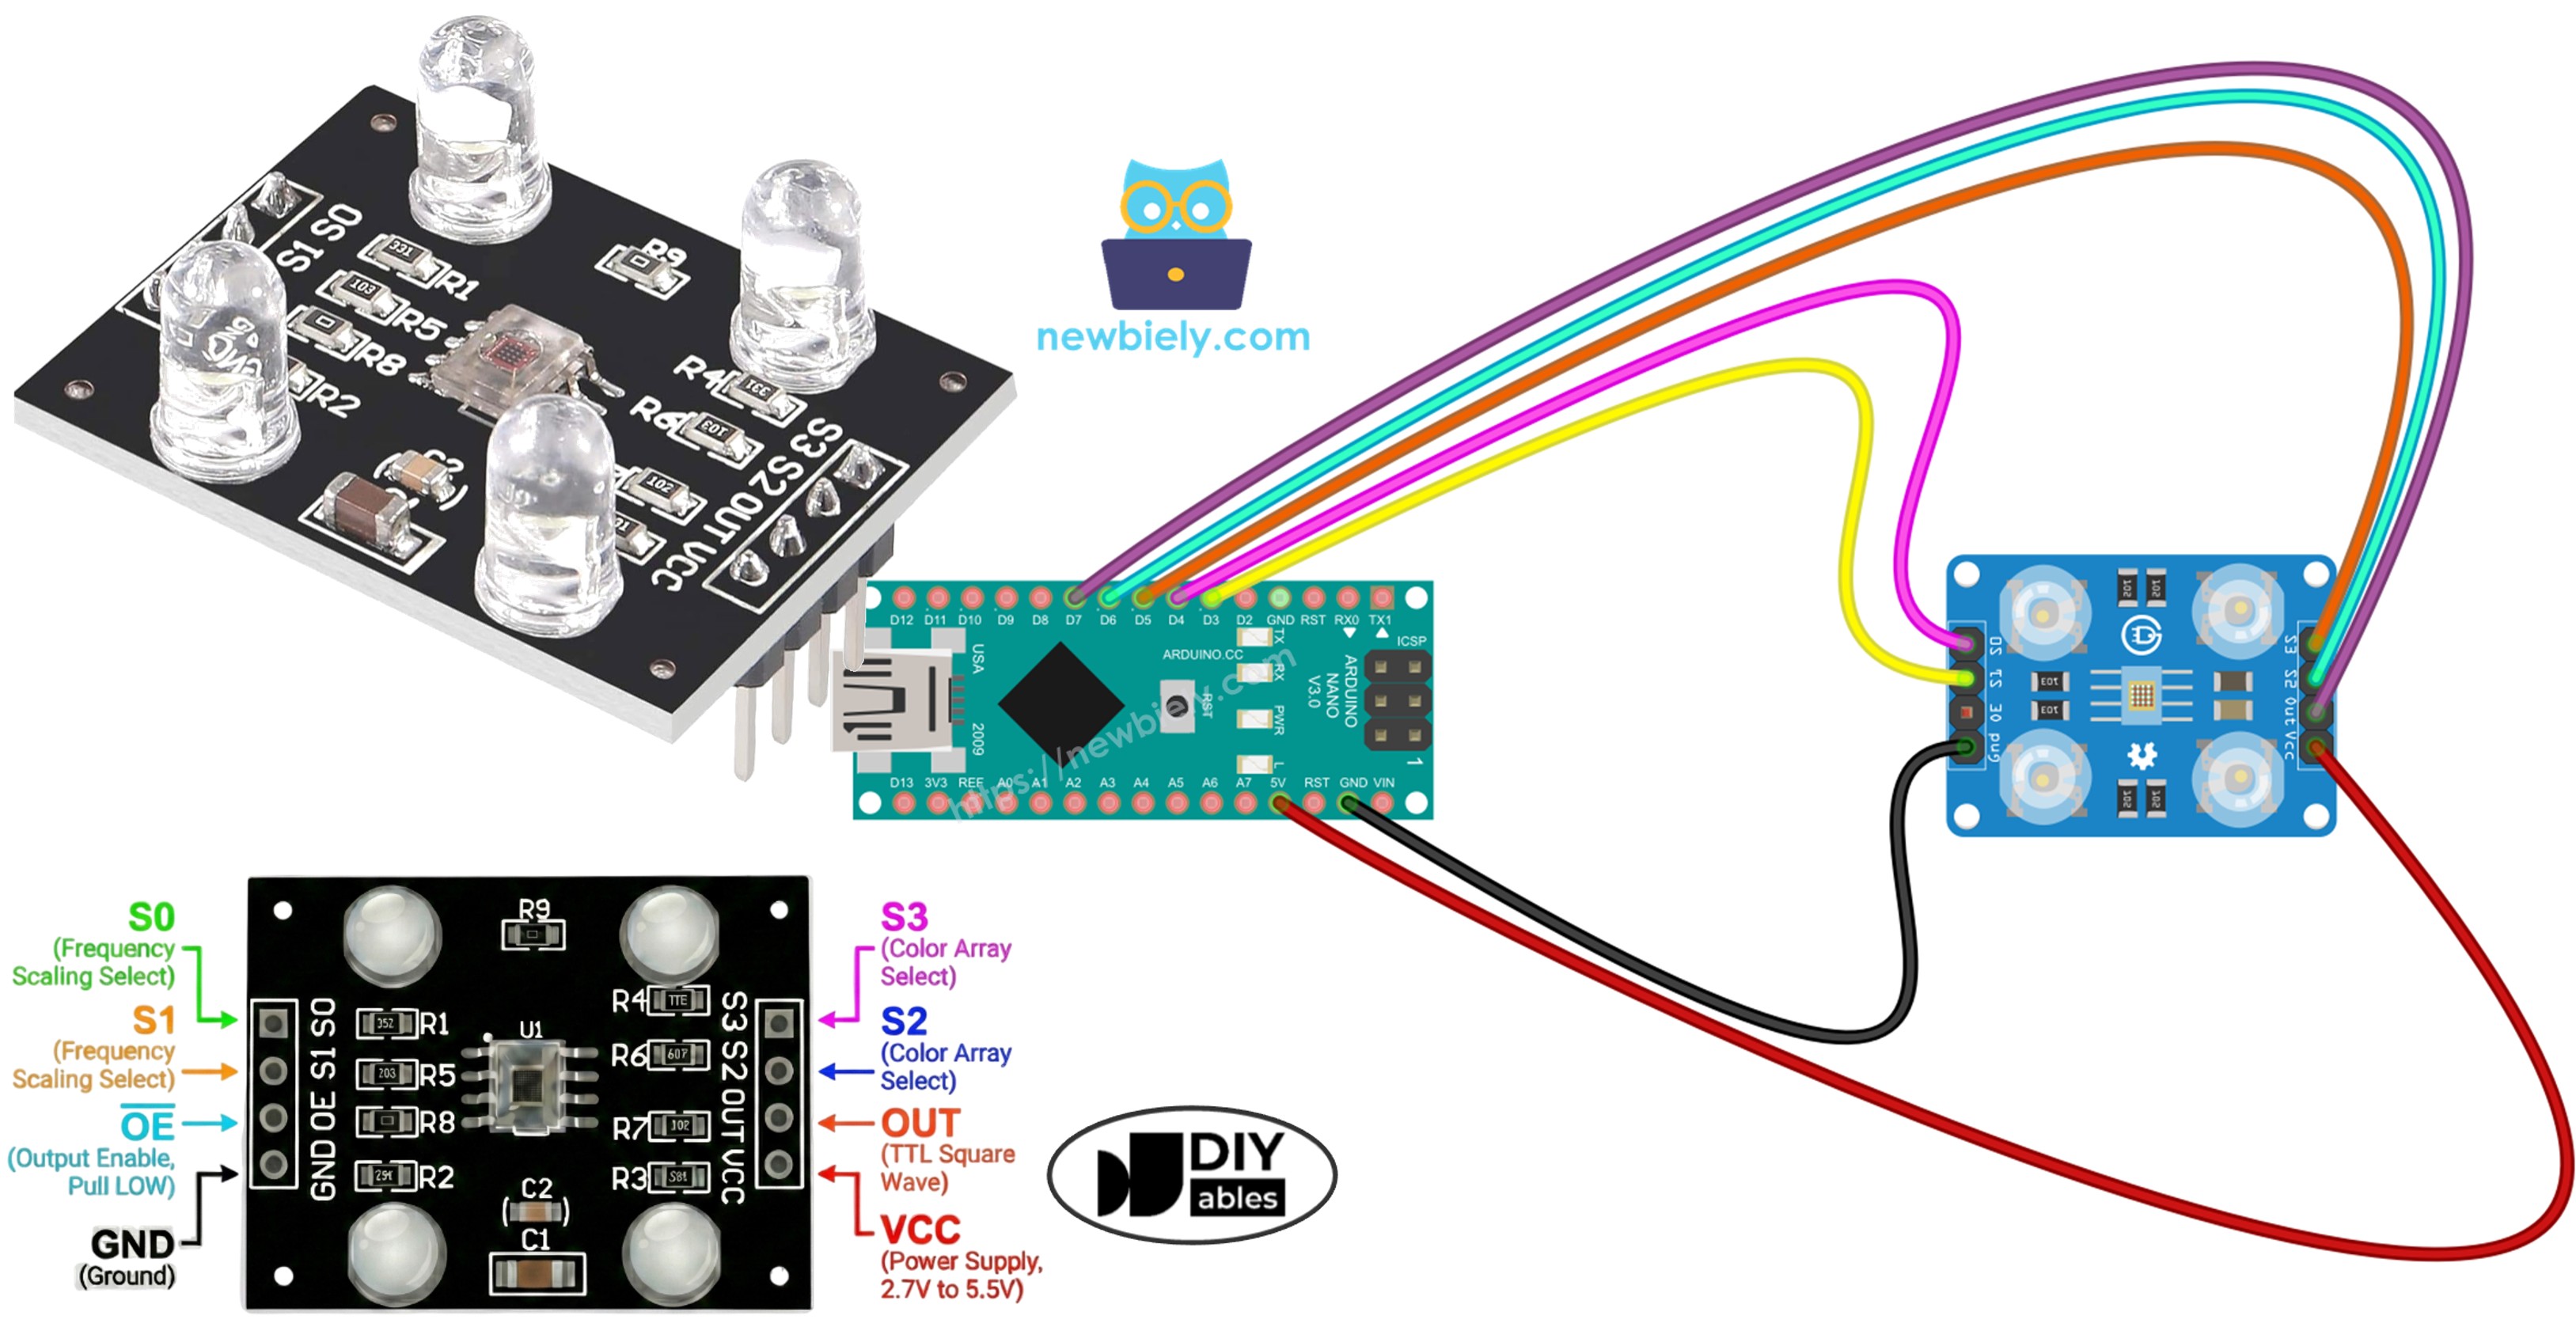
Wiring Diagram
TCS3200 color sensor to Arduino Nano wiring configuration:
| TCS3200 Color Sensor | Arduino Nano |
|---|---|
| VCC | 5V |
| GND | GND |
| S0 | D4 |
| S1 | D3 |
| S2 | D6 |
| S3 | D5 |
| OUT | D7 |
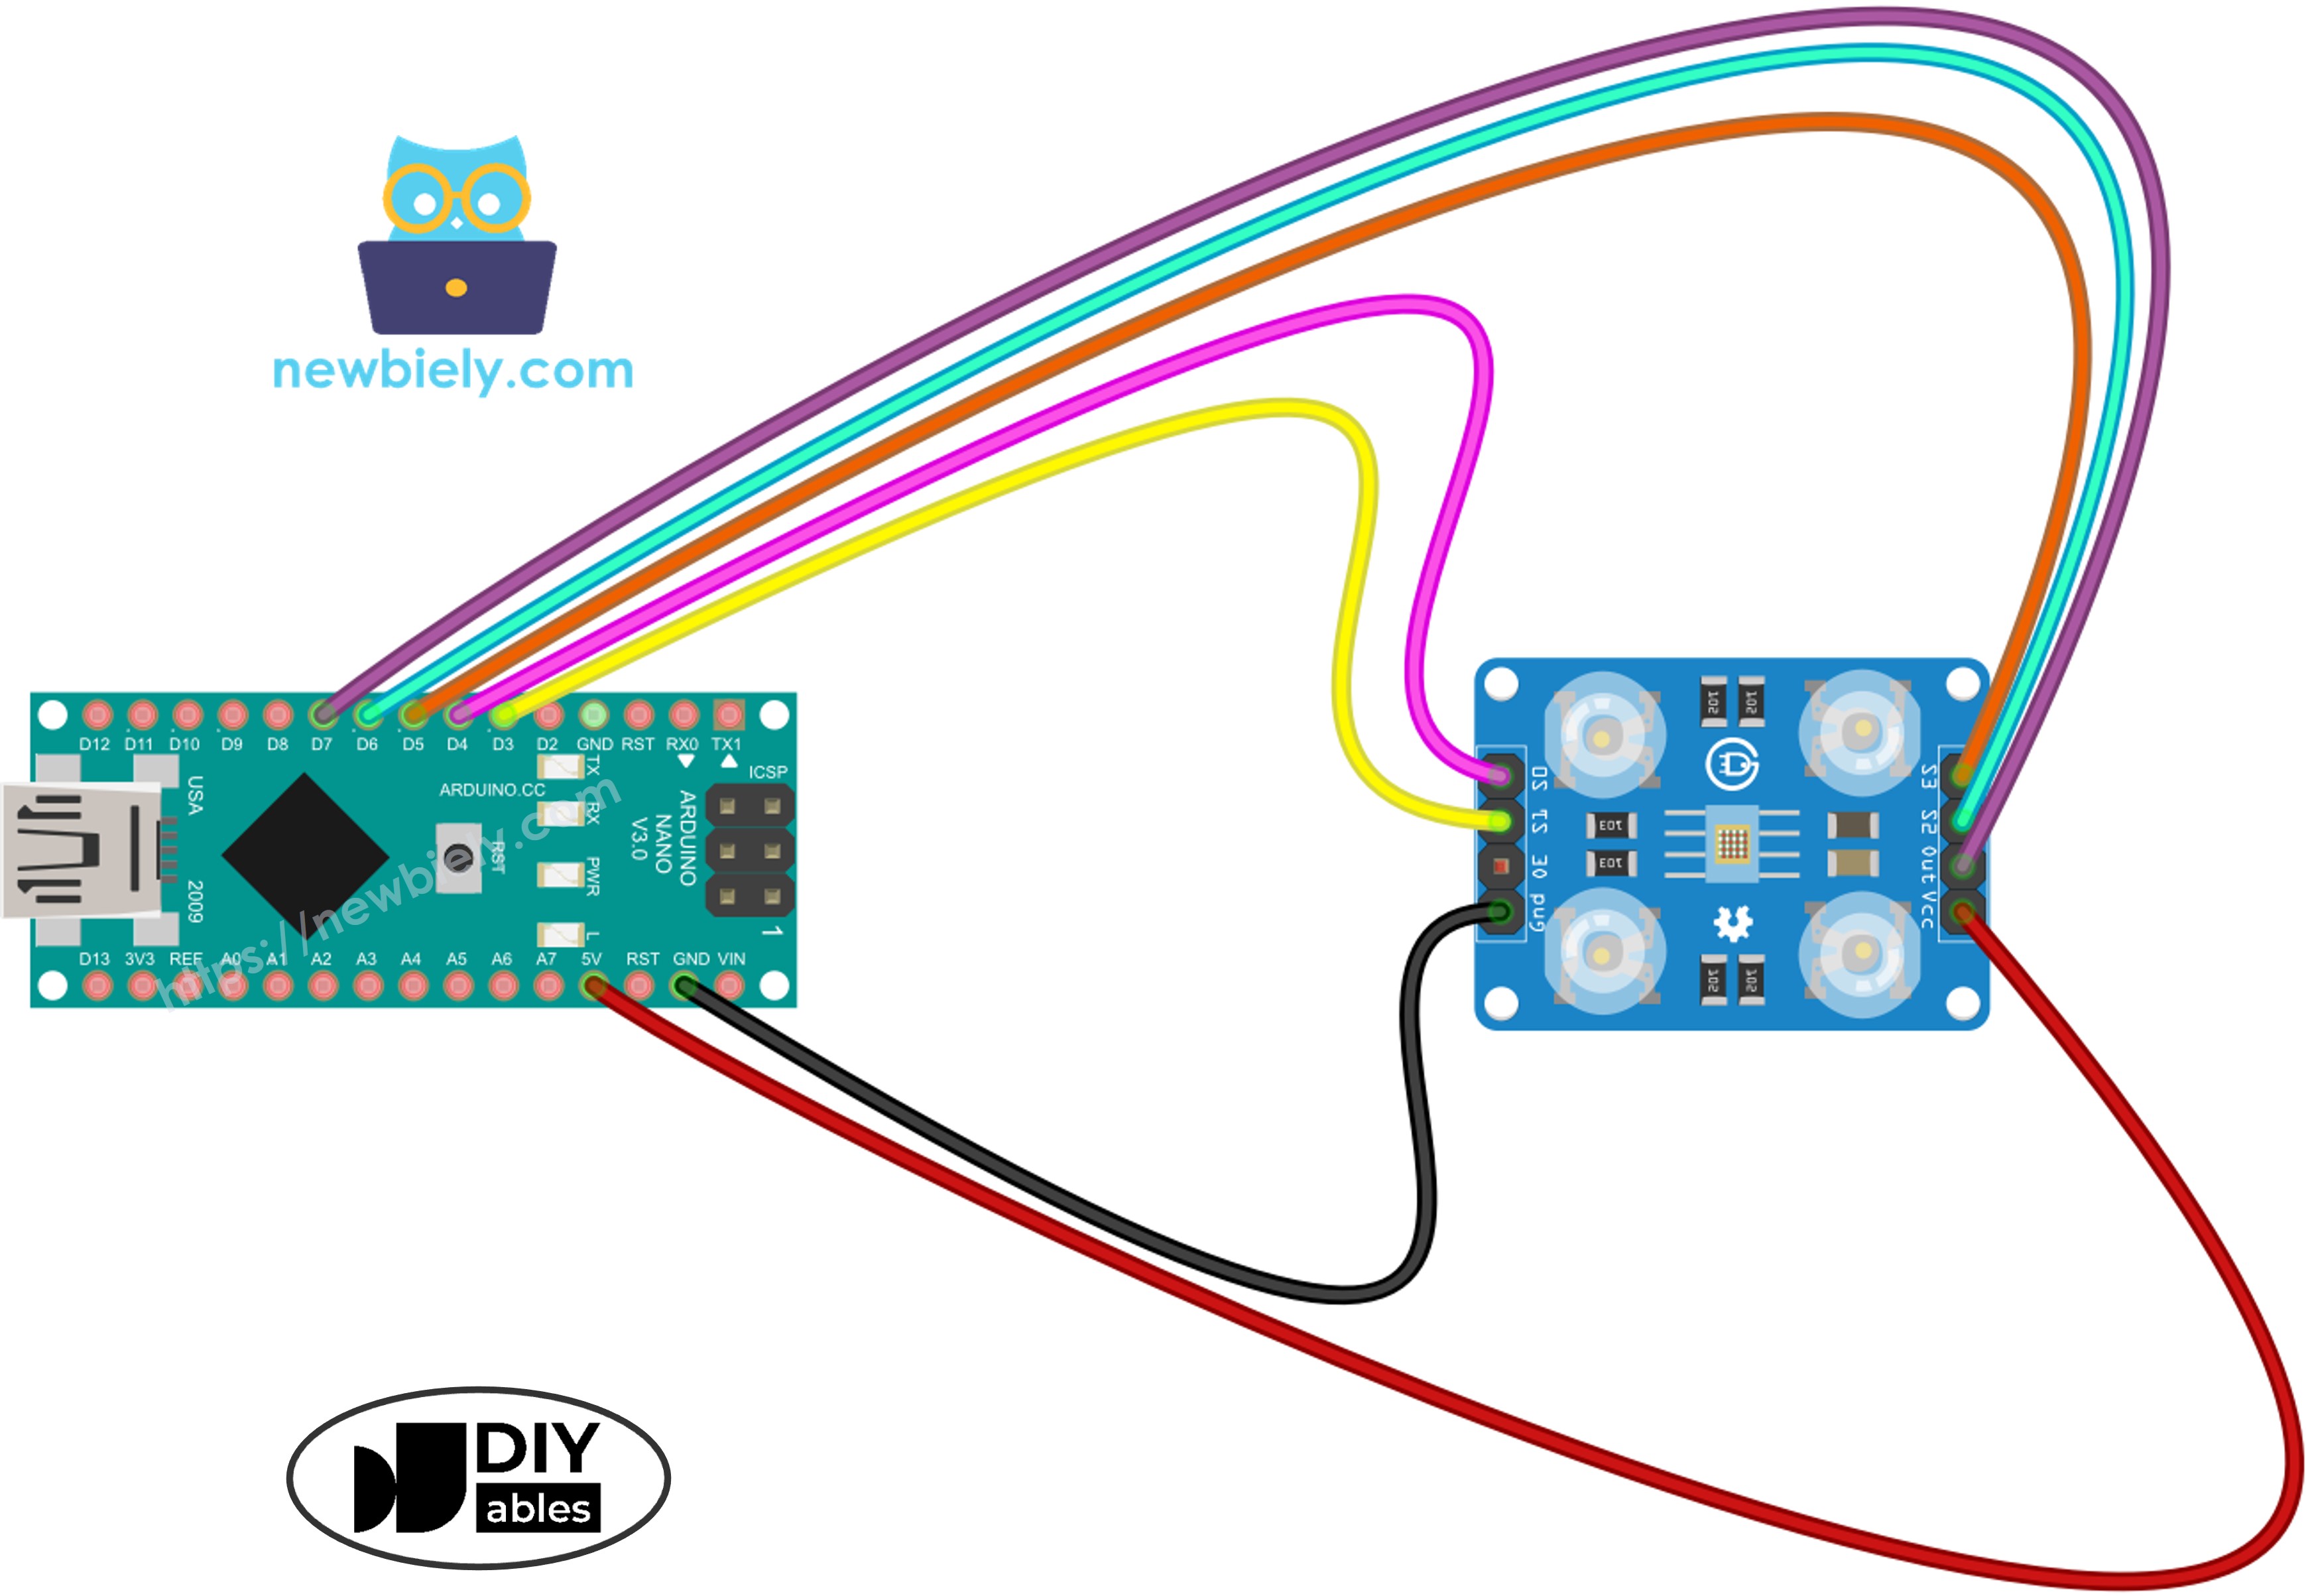
This image is created using Fritzing. Click to enlarge image
See The best way to supply power to the Arduino Nano and other components.
Arduino Nano Code - Pulse Width Calibration
Calibration eliminates environmental interference from raw measurements. Variables including LED output strength, target spacing, material reflectivity, and room lighting all affect readings. Think of these as systematic errors requiring measurement. The calibration routine identifies minimum and maximum pulse widths across all color channels, establishing reference boundaries for converting raw data into accurate 0–255 RGB values matched to your deployment environment.
Detailed Instructions
- Load the calibration sketch into Arduino IDE
- Connect Arduino Nano via USB and upload using the Upload button
- Access Serial Monitor to observe real-time Min/Max tracking
- Expose sensor to diverse surfaces: white materials (printer paper), black objects, plus multi-colored items
- Watch Min/Max boundaries update automatically as extremes are detected
- Once values stabilize (generally 10-20 seconds), document all six calibration parameters
Sample calibration parameters extracted from above output:
- RedMin = 42, redMax = 210
- GreenMin = 55, greenMax = 185
- BlueMin = 60, blueMax = 172
Arduino Nano Code - RGB Value Measurement
Detailed Instructions
- Identify calibration variables at code start:
- Substitute all six zero placeholders with measured calibration data. Example using values redMin = 42, redMax = 210, greenMin = 55, greenMax = 185, blueMin = 60, blueMax = 172:
- Transfer updated code to Arduino Nano
- Arrange colored sample before sensor
- Check RGB output via Serial Monitor
Displayed RGB values conform to standard 0-255 scaling. Reduced pulse widths (indicating brighter reflections) generate higher RGB outputs; extended pulse widths (dimmer reflections) yield lower values.
Project Applications
With operational RGB measurement capability, you can develop:
- Chromatic sorting system: Categorize objects by color (red/green/blue differentiation)
- Color verification device: Confirm color consistency between samples
- Colored path follower: Robots that navigate along chromatic markers
- Visual quality inspection: Detect production defects via color analysis
- Color-triggered automation: Execute actions when specific hues are detected