Arduino Nano - 10 Segment LED Bar Graph
Or you can buy the following kits:
| 1 | × | DIYables Sensor Kit (18 sensors/displays) |
Additionally, some of these links are for products from our own brand, DIYables .
This tutorial instructs you how to use Arduino Nano to control the 10 Segment LED Bar Graph display. In detail, we will learn:
- How to connect the Arduino Nano to the 10 Segment LED Bar Graph
- How to program the Arduino Nano to drive the LED bar display
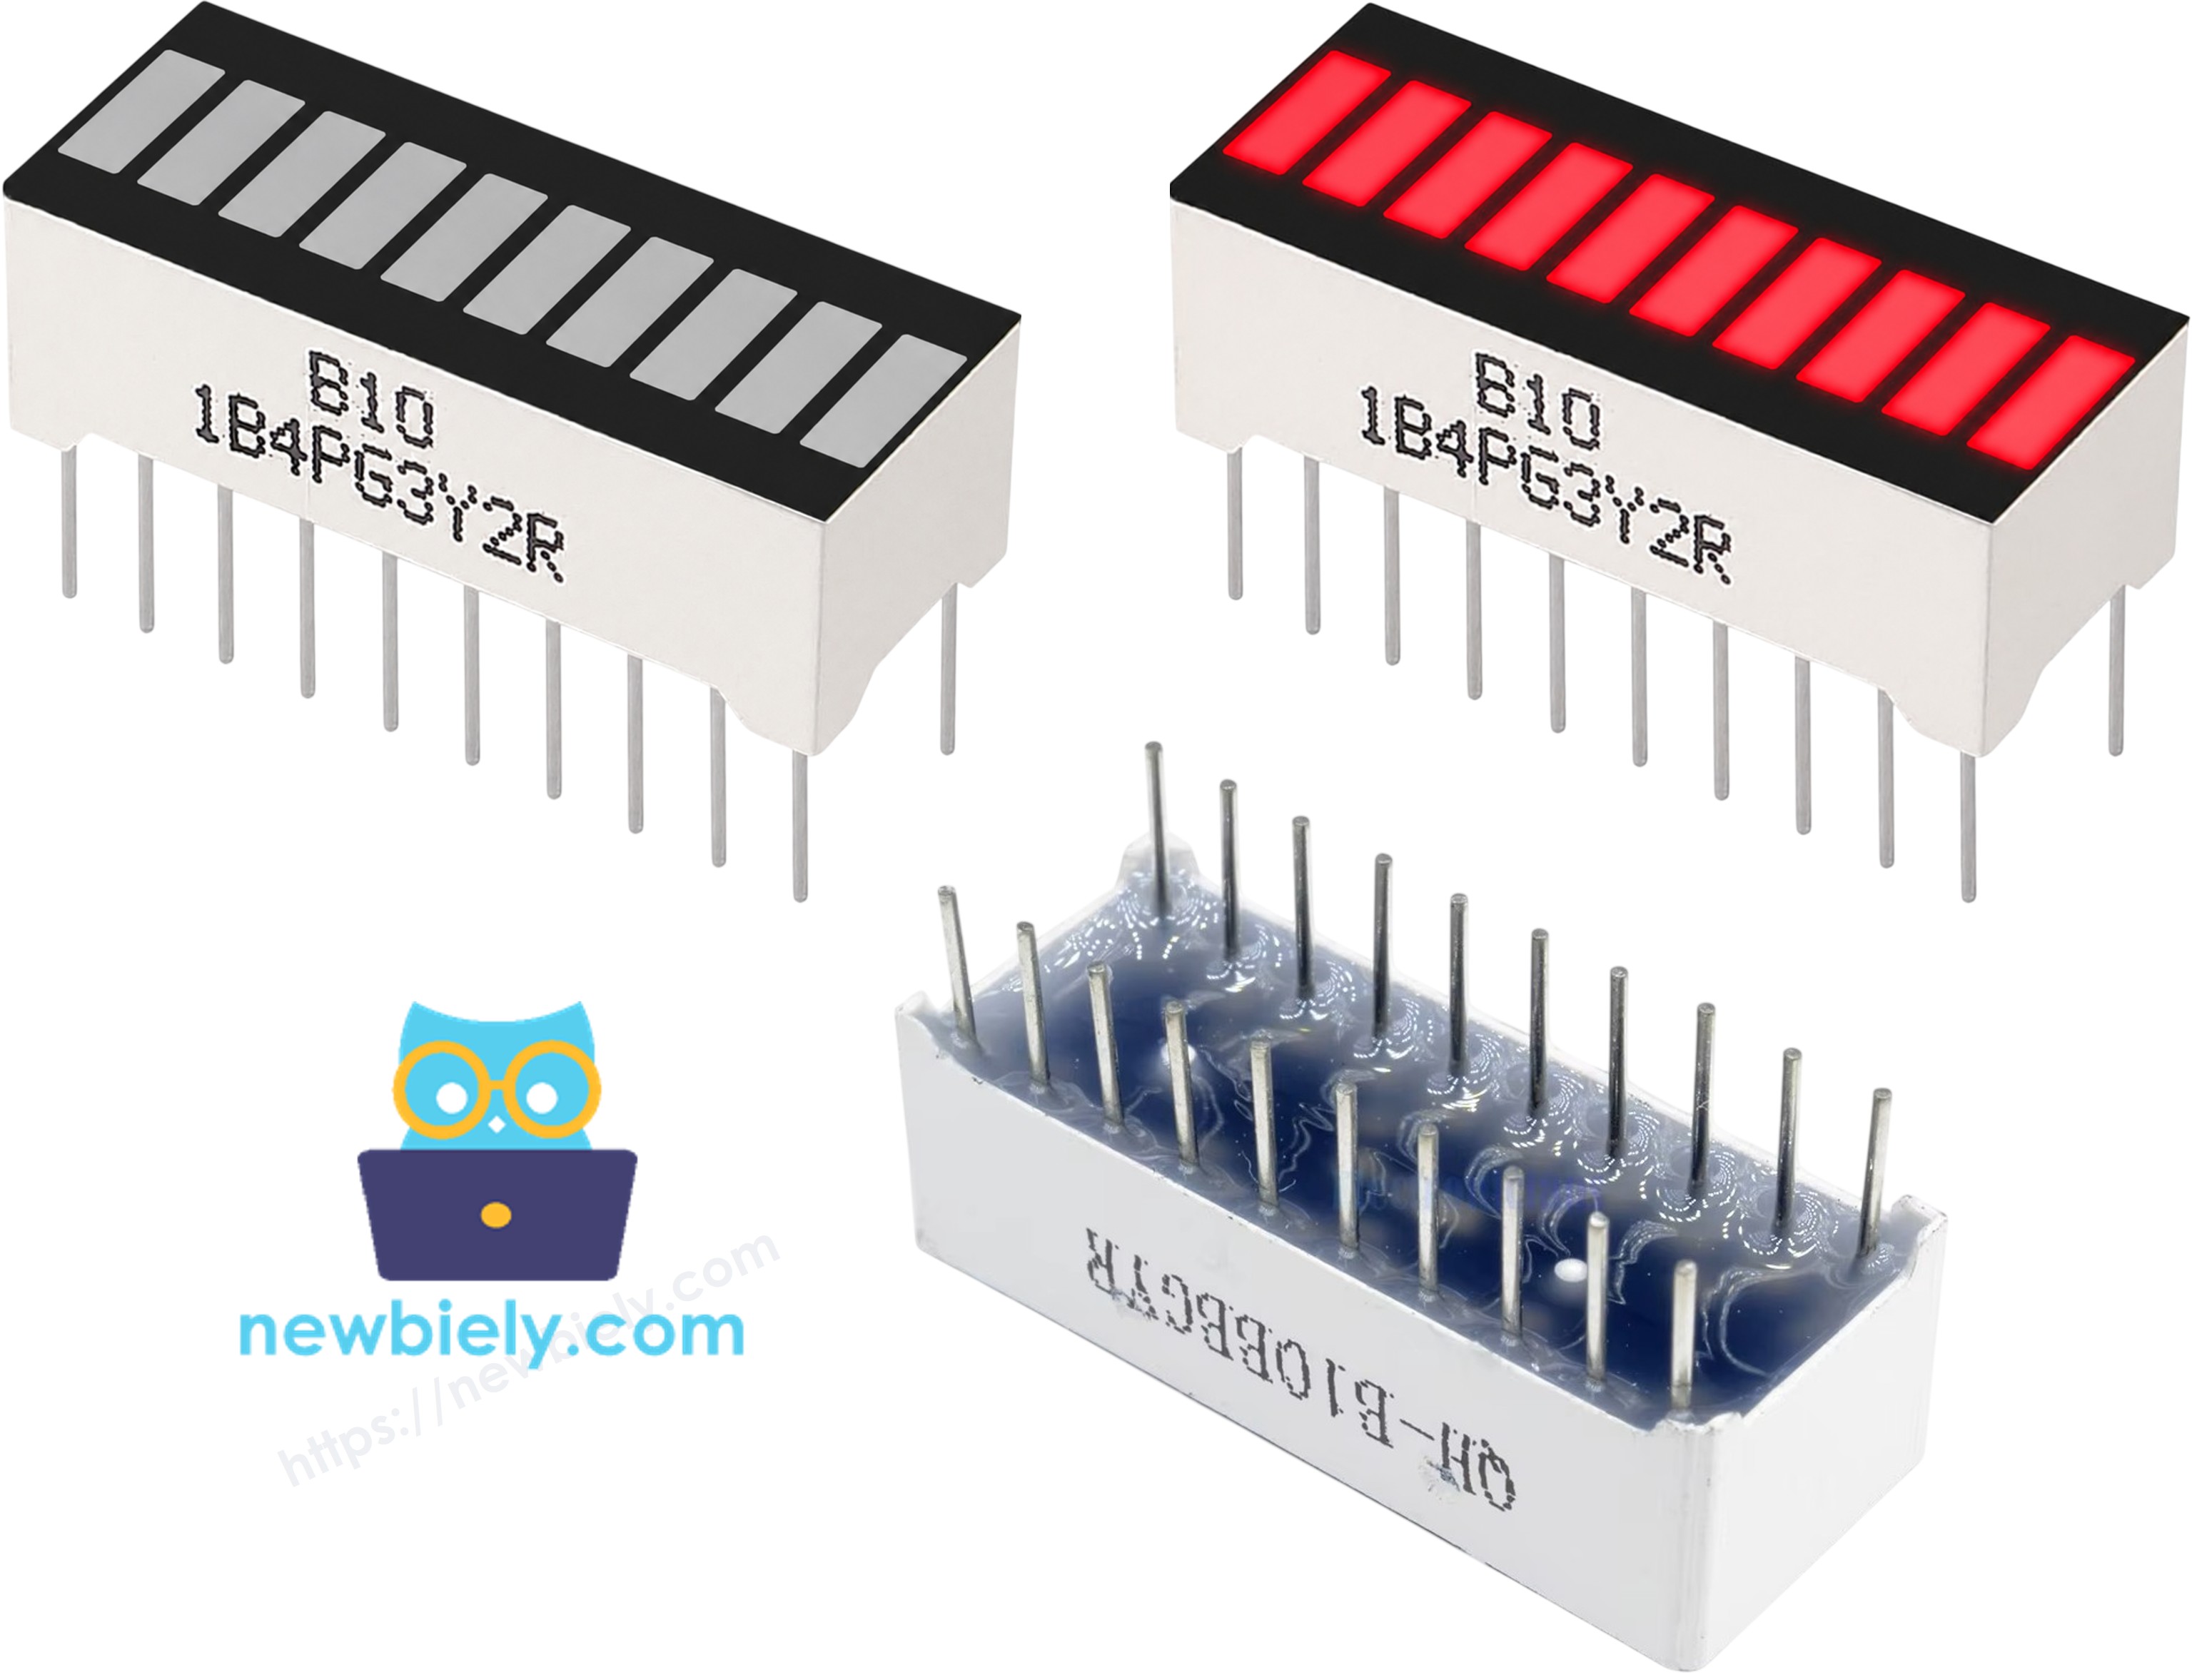
Overview of 10 Segment LED Bar Graph
| 10 Segment LED Bar Graph | |
|---|---|
| Number of Segments | 10 |
| LED Color | Bright red |
| Forward Voltage | ~2V per segment |
| Forward Current | 20mA max per segment |
| Resistor Required | 220Ω per segment |
The 10 Segment LED Bar Graph Pinout
- Anode pins (A1–A10): must be connected to GPIO pins via 220Ω resistors
- Cathode pins (K1–K10): must be connected to GND
※ NOTE THAT:
The pin layout on your specific LED bar graph may vary by manufacturer. Always check the datasheet or the markings printed on the component before wiring. Take a close look!
Wiring Diagram
The table below shows how to wire the 10 Segment LED Bar Graph to the Arduino Nano.
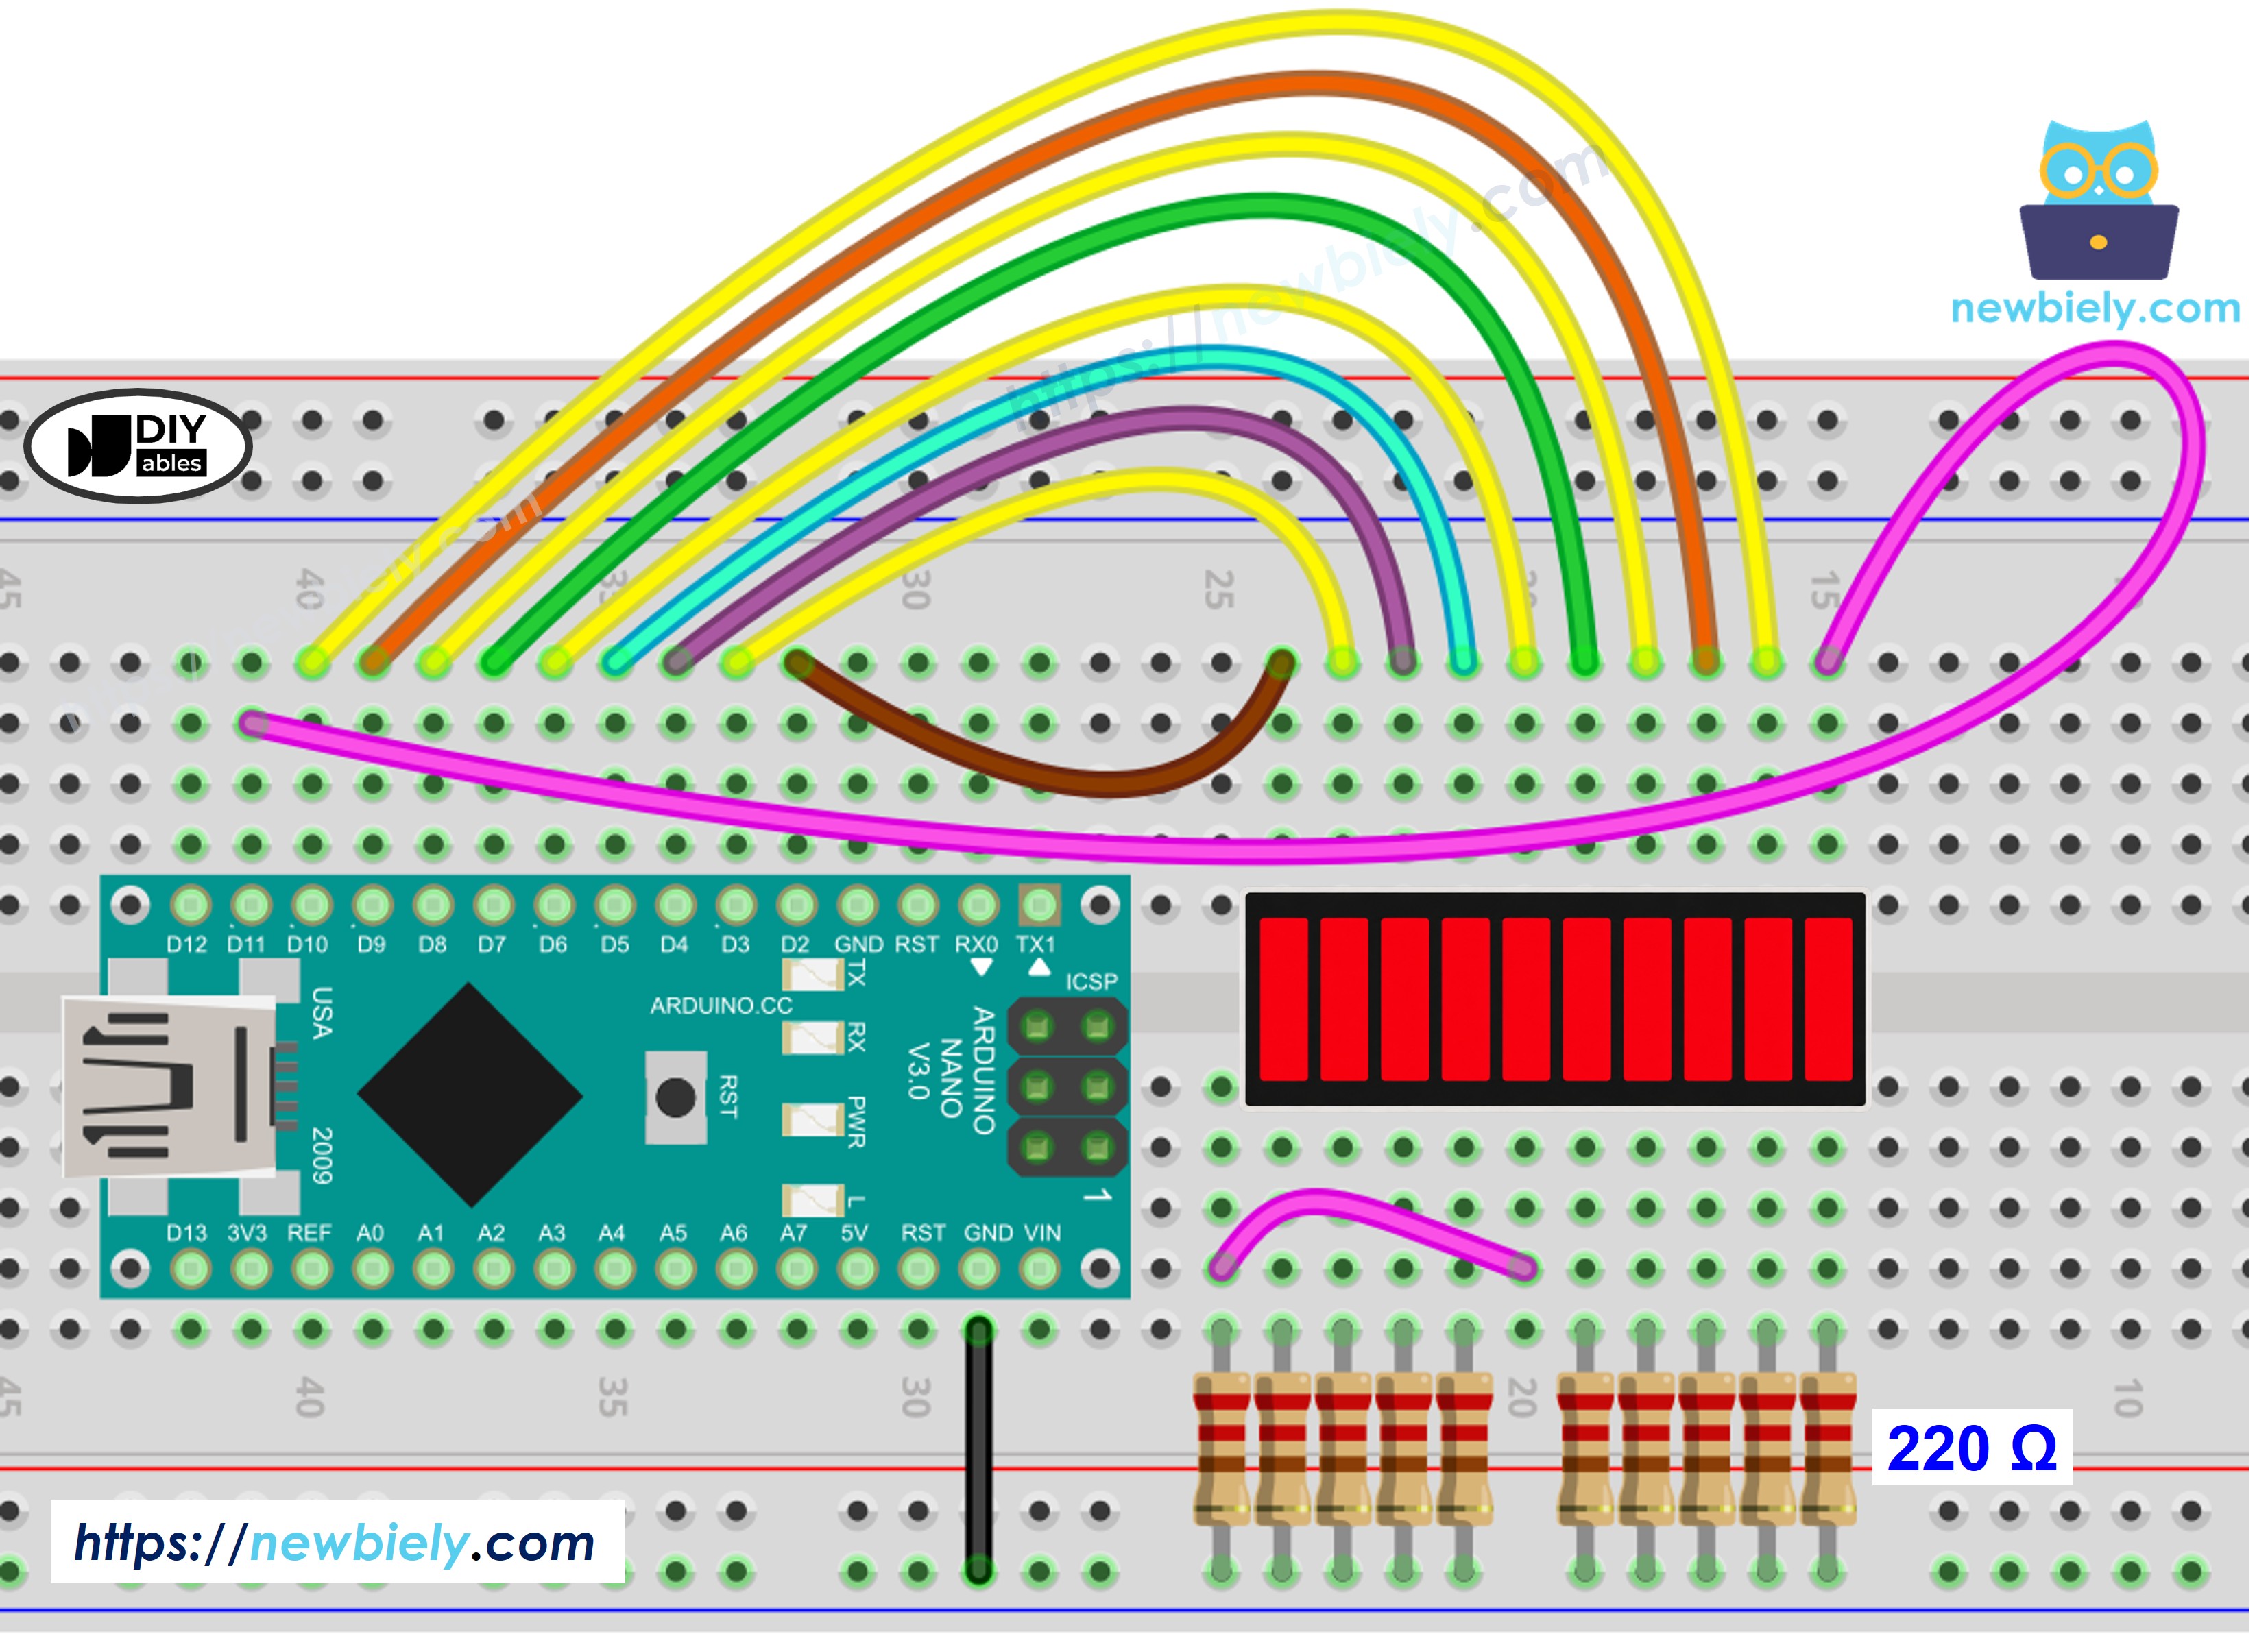
This image is created using Fritzing. Click to enlarge image
See The best way to supply power to the Arduino Nano and other components.
| LED Bar Graph | Arduino Nano Pin |
|---|---|
| A1 (Anode 1) | Pin 2 (via 220Ω) |
| A2 (Anode 2) | Pin 3 (via 220Ω) |
| A3 (Anode 3) | Pin 4 (via 220Ω) |
| A4 (Anode 4) | Pin 5 (via 220Ω) |
| A5 (Anode 5) | Pin 6 (via 220Ω) |
| A6 (Anode 6) | Pin 7 (via 220Ω) |
| A7 (Anode 7) | Pin 8 (via 220Ω) |
| A8 (Anode 8) | Pin 9 (via 220Ω) |
| A9 (Anode 9) | Pin 10 (via 220Ω) |
| A10 (Anode 10) | Pin 11 (via 220Ω) |
| K1–K10 (Cathodes) | GND |
How To Program Arduino Nano for 10 Segment LED Bar Graph
No library installation is required to use the 10 Segment LED Bar Graph with Arduino Nano — the component is driven directly through GPIO pins using built-in Arduino functions.
- The first step is to define the output pins connected to the LED bar graph anodes: const int ledPins[10] = {2, 3, 4, 5, 6, 7, 8, 9, 10, 11};
- Specify each pin as an output using pinMode()
- Turn on a segment using digitalWrite(ledPins[i], HIGH);
- Turn off a segment using digitalWrite(ledPins[i], LOW);
Arduino Nano Code for 10 Segment LED Bar Graph
Detailed Instructions
If this is the first time you use Arduino Nano, see how to set up the Arduino Nano environment in Arduino IDE.
- Wire the components as shown in the diagram.
- Connect the Arduino Nano board to your computer using a USB cable.
- Open Arduino IDE on your computer.
- Select the correct board and port under Tools.
- Copy the code above and paste it into the Arduino IDE.
- Click Upload to flash the code onto the Arduino Nano.
- Open the Serial Monitor at baud rate 9600 to observe the output.
Serial Monitor Output
Additional Knowledge
The 10 Segment LED Bar Graph is well suited for use as a visual level indicator in projects where a numerical readout is less intuitive than a graduated bar. Because each segment corresponds to a discrete step, the display gives an immediate visual sense of quantity or intensity without requiring the viewer to read a number.
Practical applications include battery charge meters, audio volume bars, signal strength indicators, and progress displays for timed operations. In each case, the number of illuminated segments represents a proportion of some measured value — for example, lighting five of ten segments to indicate 50% charge or half-volume.
When building such applications, the typical approach is to map the measured value to a segment count by scaling it against the sensor's full range, then lighting that many segments in sequence. This mapping can be done with Arduino's map() function, which makes the calculation straightforward and easy to adjust as the input range changes.