
ESP32 S3 - 10 Segment LED Bar Graph
Or you can buy the following kits:
| 1 | × | DIYables ESP32 S3 Starter Kit (ESP32 S3 included) | |
| 1 | × | DIYables Sensor Kit (18 sensors/displays) |
Additionally, some of these links are for products from our own brand, DIYables .
This beginner-friendly tutorial shows you how to use the ESP32 S3 with a 10 Segment LED Bar Graph to create animated visual displays. Whether you're building a battery level indicator, signal meter, or progress bar, this step-by-step guide will get you up and running quickly.
What you'll build in this tutorial:
- What the 10 Segment LED Bar Graph is and how it works
- How to wire the LED bar graph to the ESP32 S3
- How to write and upload the animation code
- How to observe and verify the bar animation output
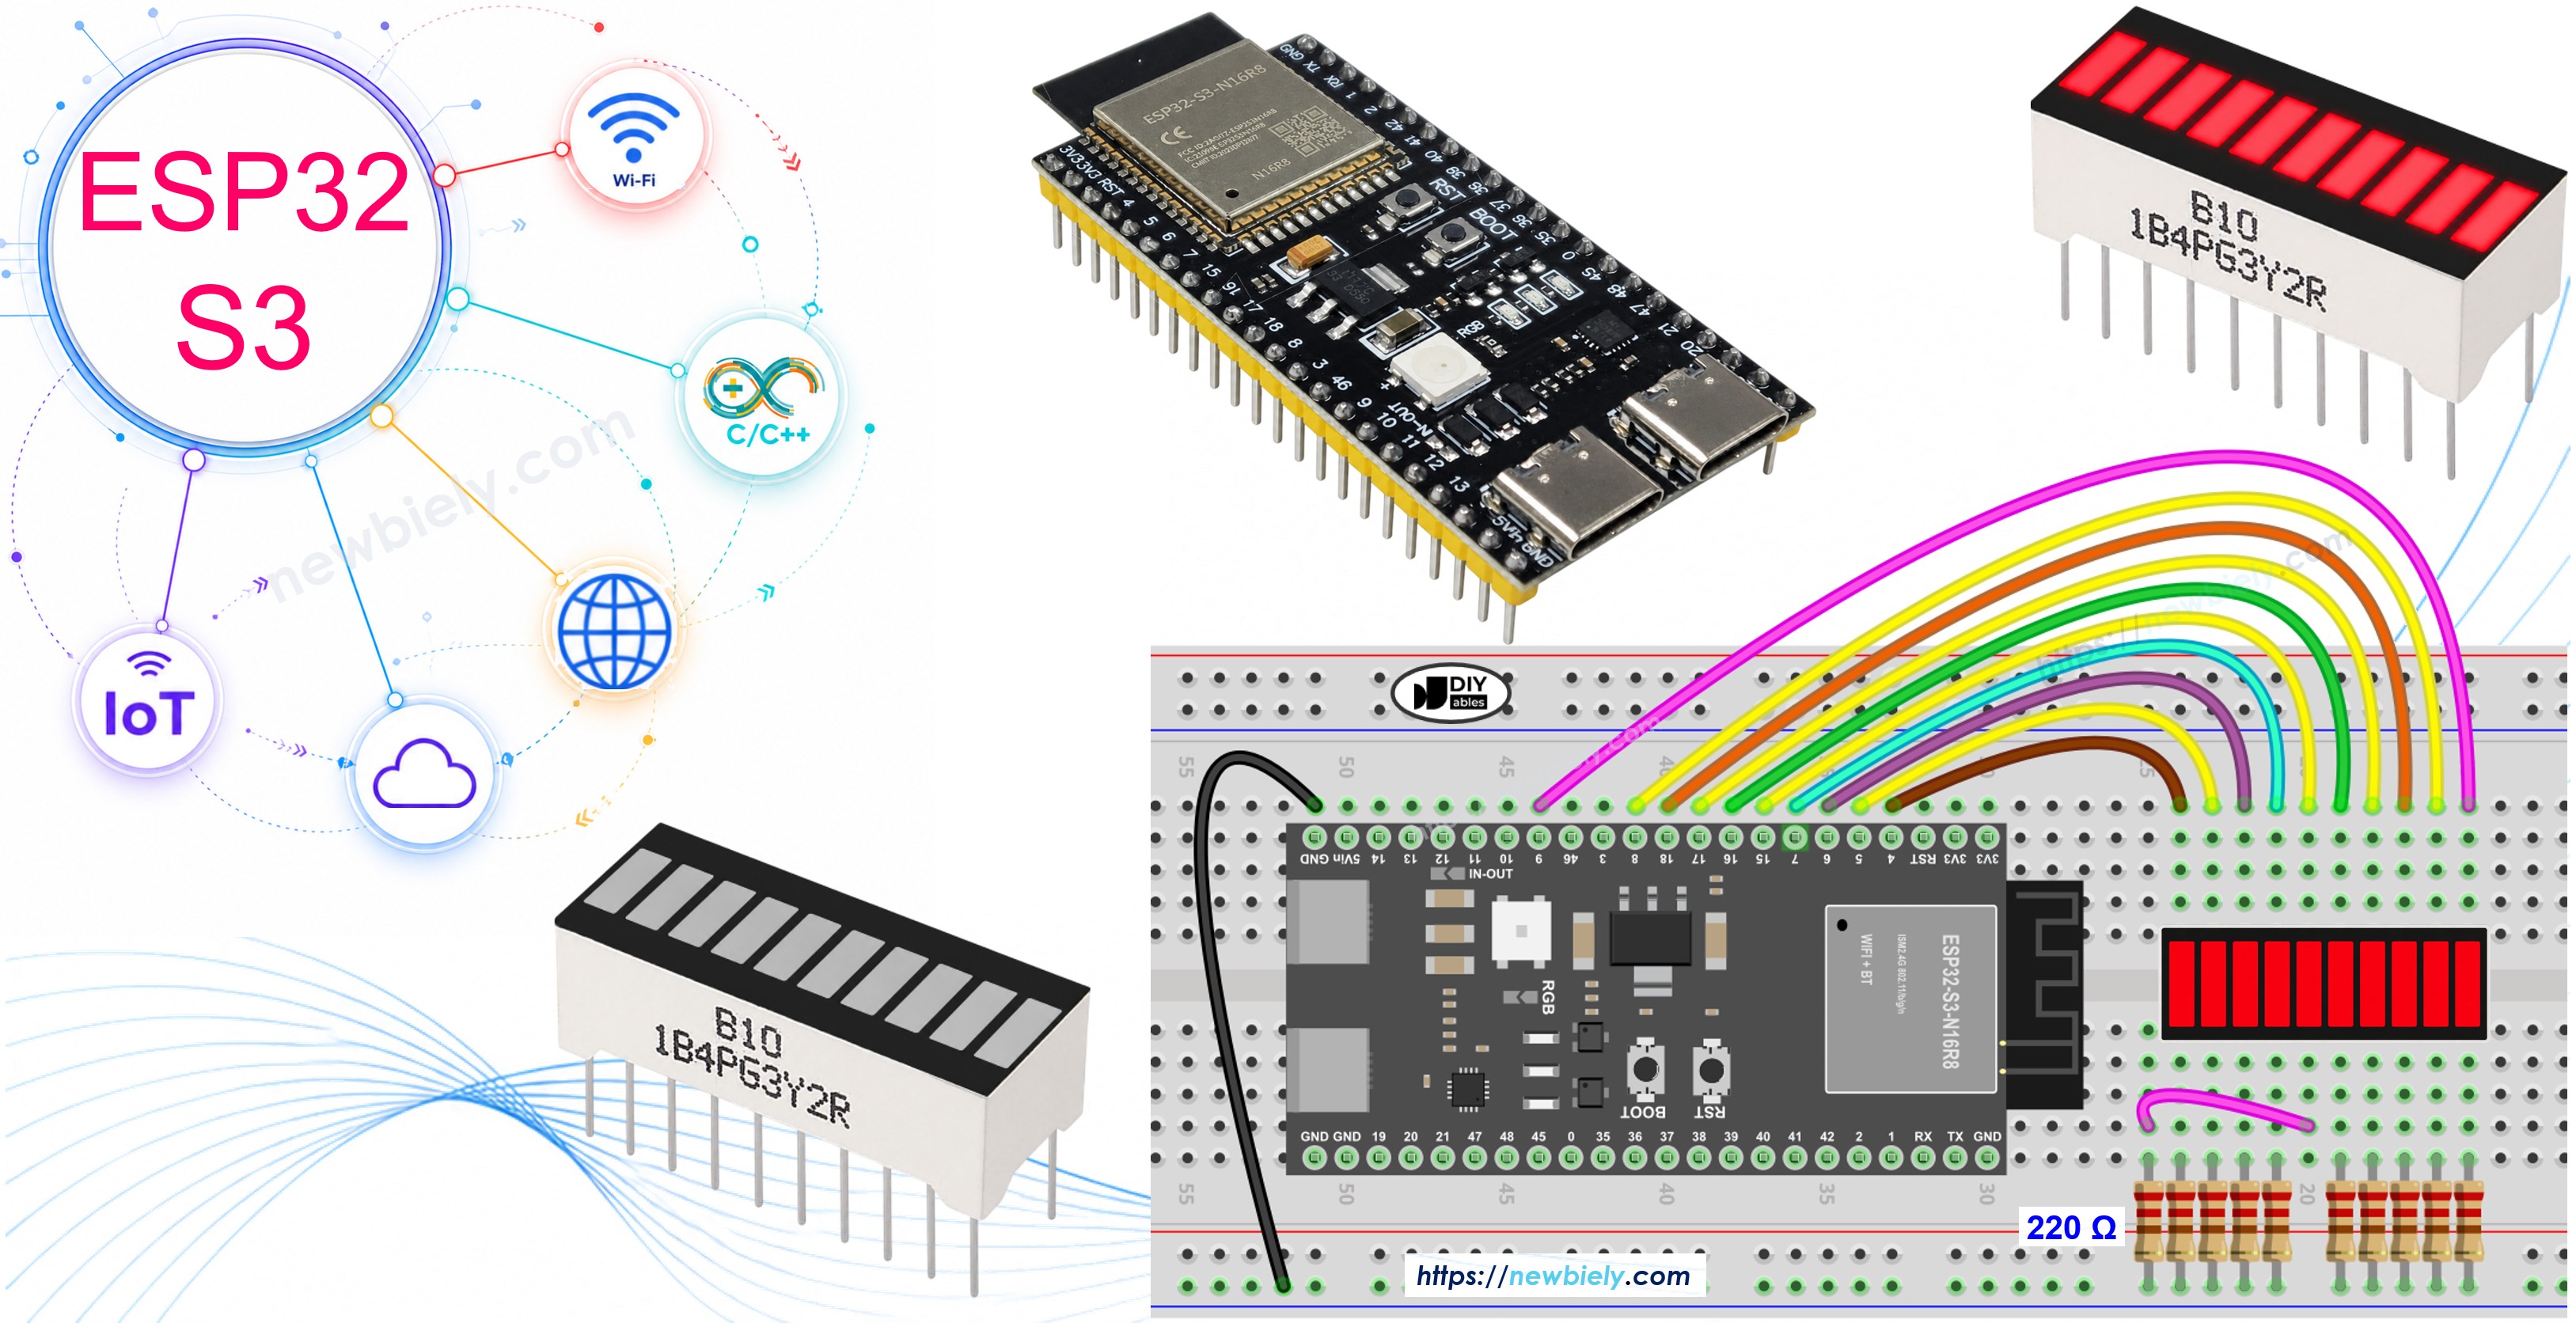
Overview of 10 Segment LED Bar Graph
The 10 Segment LED Bar Graph is a compact display component containing ten individual red LEDs arranged in a linear bar. Each segment can be independently controlled through a dedicated GPIO pin, making it ideal for creating visual level indicators, animated effects, and progress displays. It requires no external library — only the built-in digitalWrite() function.
Key Specifications
The bar graph operates at approximately 2V forward voltage per segment, with a maximum forward current of 20mA. A 220Ω current-limiting resistor is required on each anode to protect the ESP32 S3 GPIO pins. The component has 20 pins in total: 10 anodes (A1–A10) and 10 cathodes (K1–K10).
LED Bar Graph Pinout
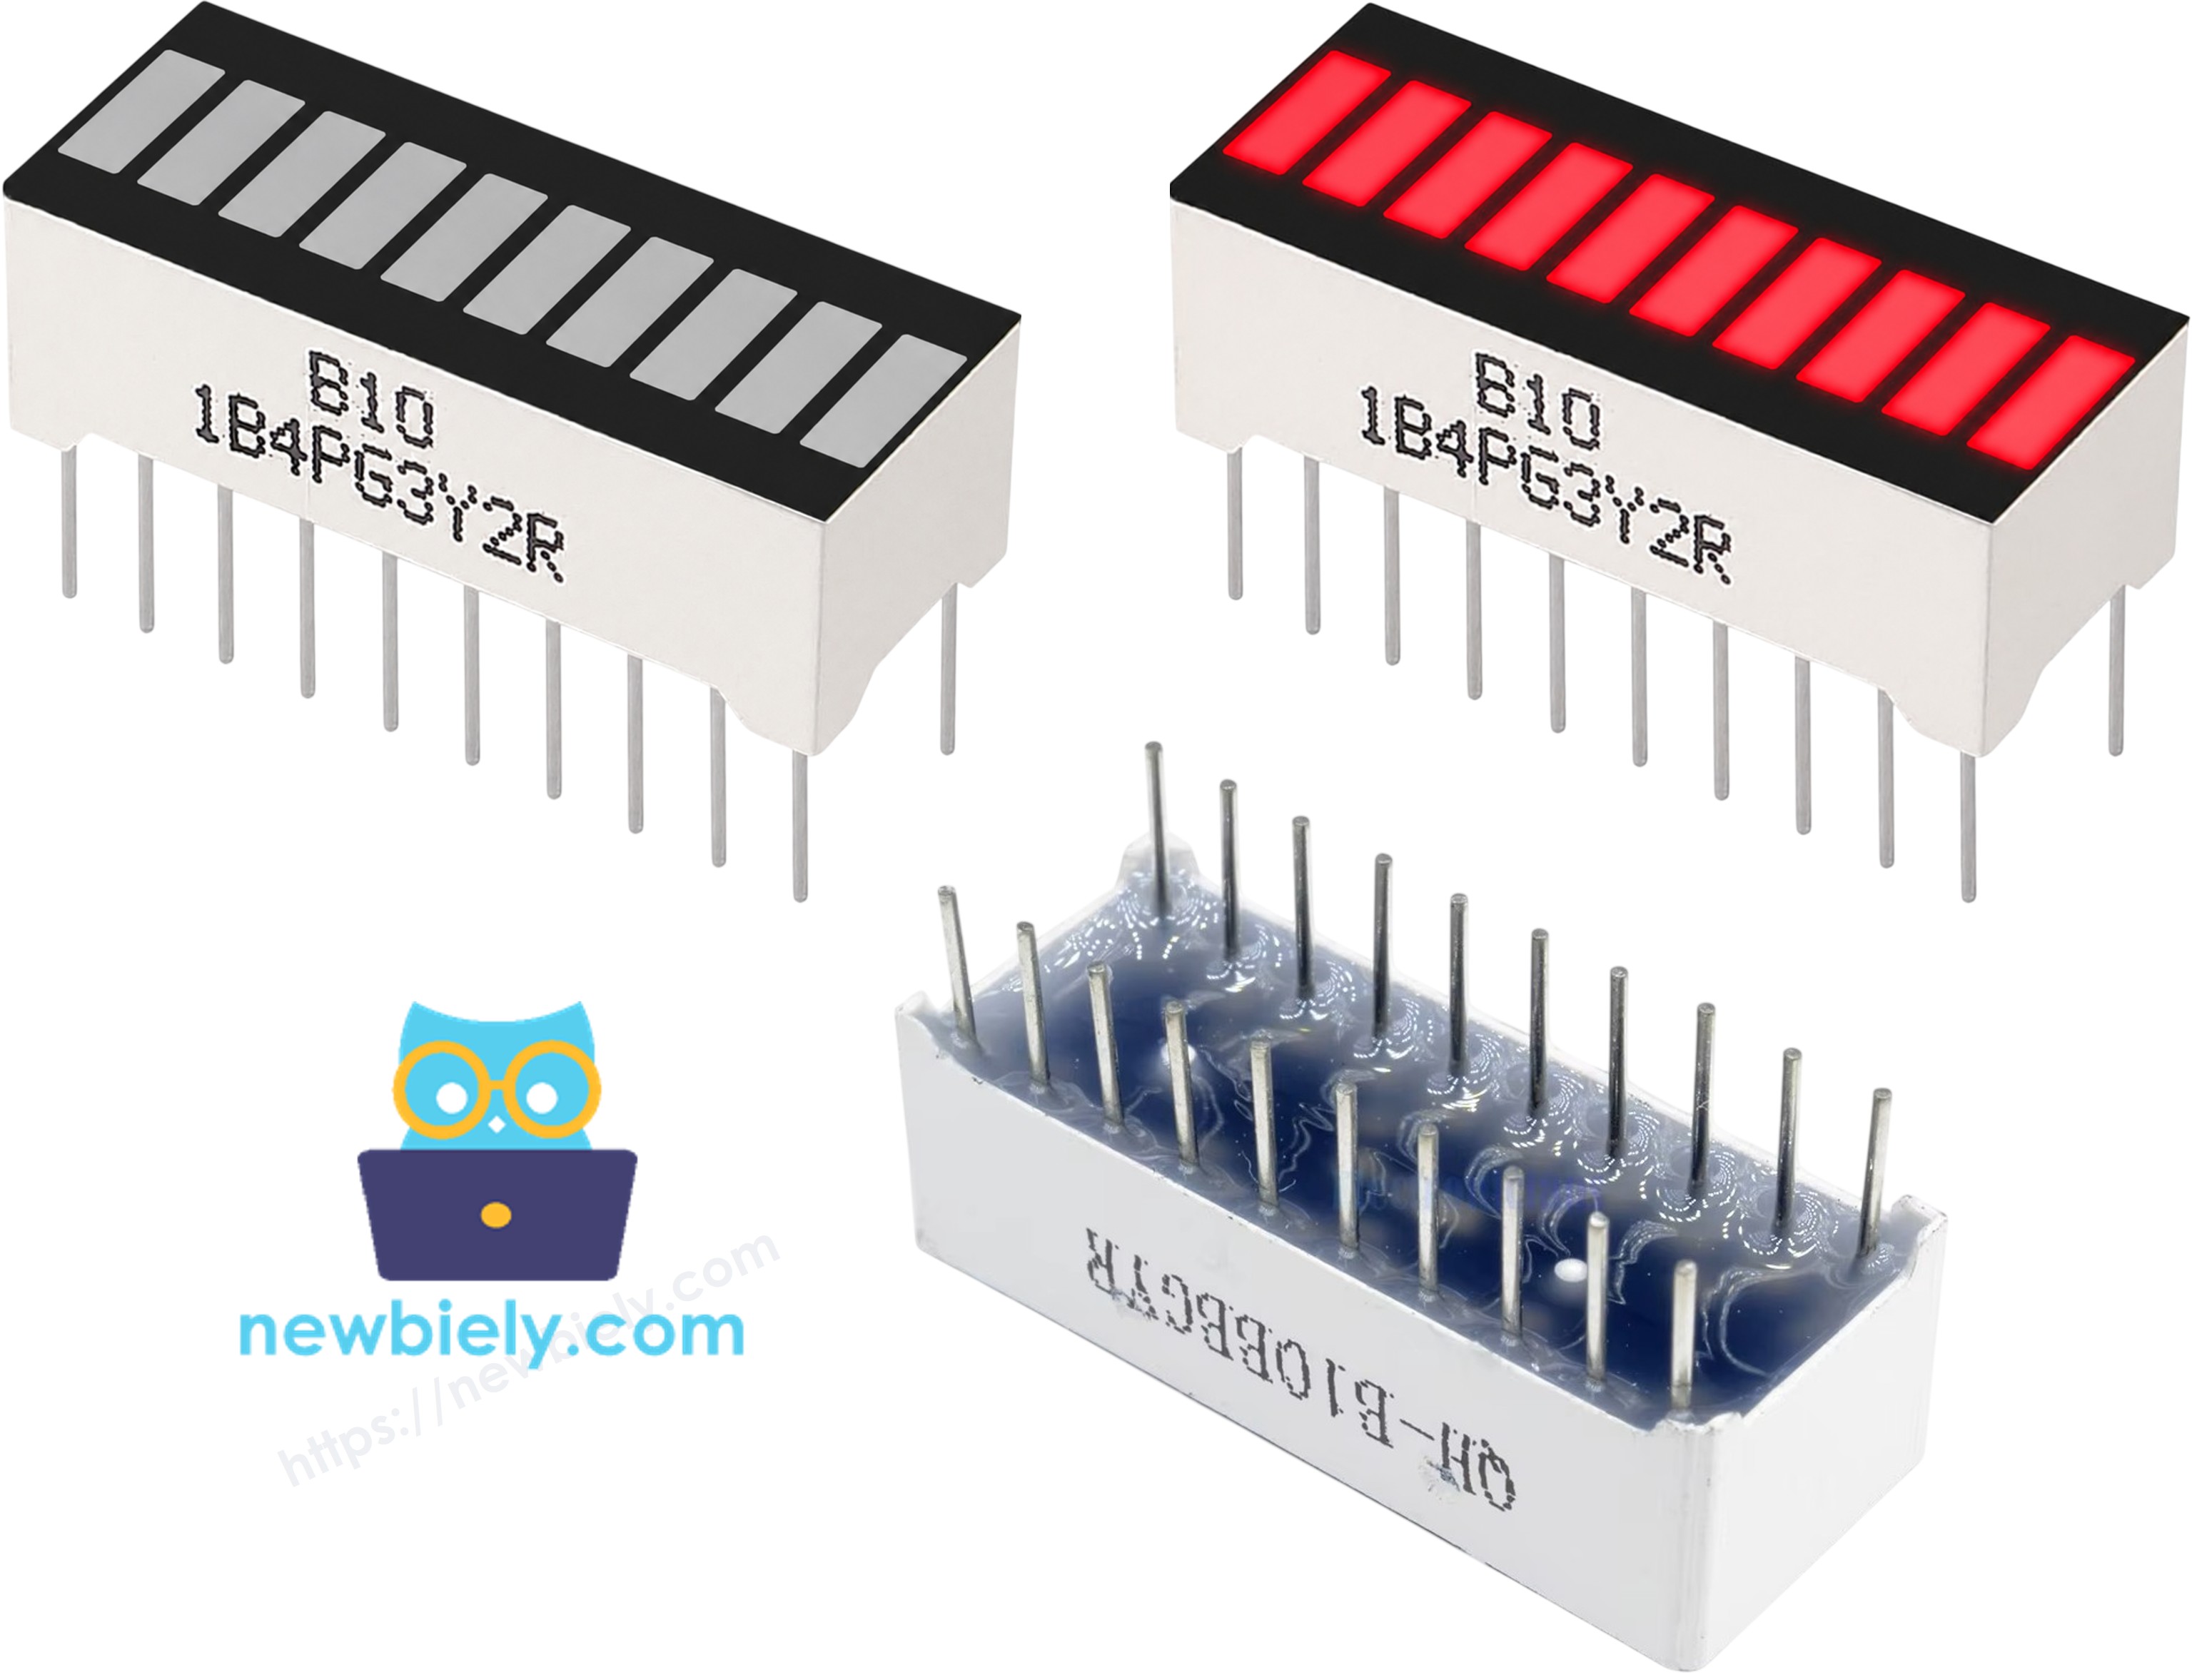
The 10 Segment LED Bar Graph has 20 pins arranged as 10 anode-cathode pairs.
- A1–A10 (Anodes) — One anode per LED segment; connect each to a GPIO pin via a 220Ω resistor
- K1–K10 (Cathodes) — One cathode per LED segment; connect all to GND
Wiring Diagram between 10 Segment LED Bar Graph and ESP32 S3
Connect each of the ten anode pins (A1–A10) to a separate ESP32 S3 GPIO pin (GPIO 4, 5, 6, 7, 15, 16, 17, 18, 8, and 9) through an individual 220Ω resistor, and connect all ten cathode pins to a common GND rail on your breadboard. These GPIO pins are free from the ESP32 S3 strapping pins and the USB/flash pins, so the board still boots and flashes normally with the bar graph attached. The 220Ω resistors limit current through each LED segment and are essential to protect the ESP32 S3 GPIO pins from damage.
Safety Notes
Always ensure the current-limiting resistors are in place before powering the circuit — driving the LED bar graph without resistors may exceed the maximum GPIO current rating of the ESP32 S3 (40mA per pin), potentially damaging the board. Use 220Ω or higher resistors for safe operation.
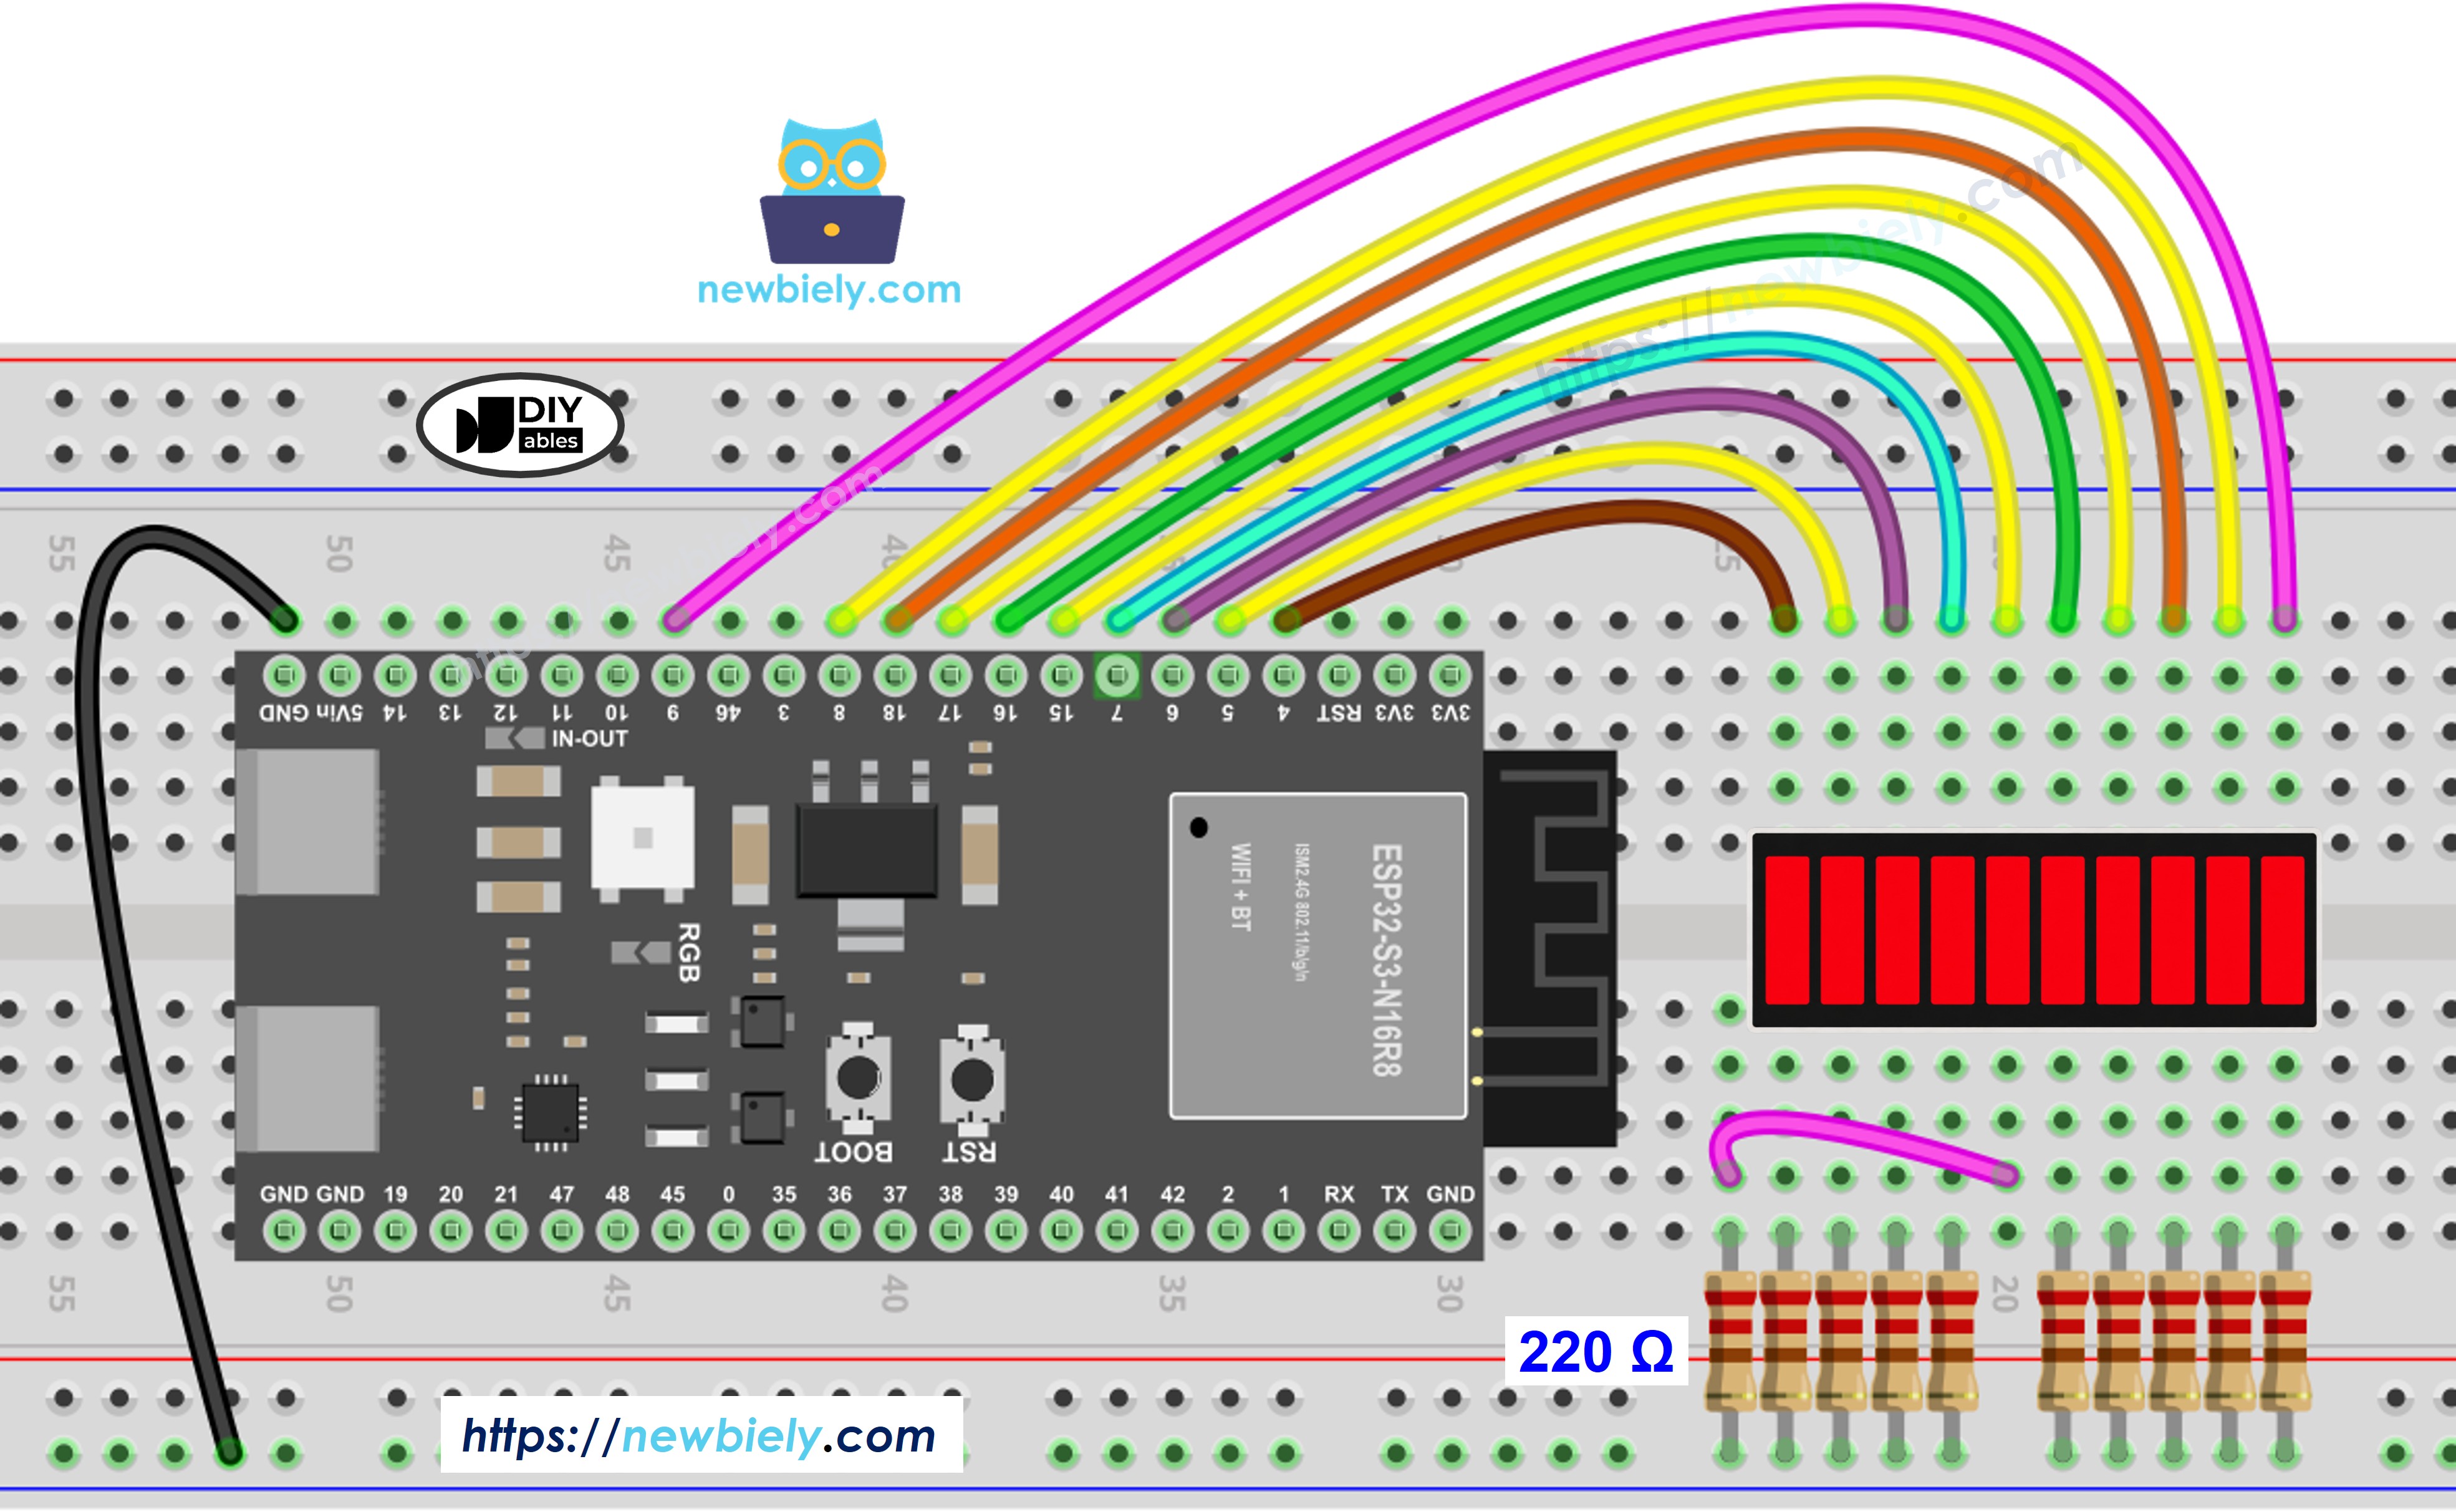
This image is created using Fritzing. Click to enlarge image
| LED Bar Graph | ESP32 S3 Pin |
|---|---|
| A1 (Anode 1) | GPIO4 (via 220Ω) |
| A2 (Anode 2) | GPIO5 (via 220Ω) |
| A3 (Anode 3) | GPIO6 (via 220Ω) |
| A4 (Anode 4) | GPIO7 (via 220Ω) |
| A5 (Anode 5) | GPIO15 (via 220Ω) |
| A6 (Anode 6) | GPIO16 (via 220Ω) |
| A7 (Anode 7) | GPIO17 (via 220Ω) |
| A8 (Anode 8) | GPIO18 (via 220Ω) |
| A9 (Anode 9) | GPIO8 (via 220Ω) |
| A10 (Anode 10) | GPIO9 (via 220Ω) |
| K1–K10 (Cathodes) | GND |
ESP32 S3 Code - 10 Segment LED Bar Graph
The following code initializes GPIO pins 4, 5, 6, 7, 15, 16, 17, 18, 8, and 9 as outputs and runs a continuous bar animation. It fills the bar from left to right by turning on each segment with a 100ms pause between each step, holds the full bar for 500ms, then empties it from right to left at the same pace. The current bar state is printed to the Serial Monitor on each step, producing a scrolling text representation of the animation.
- New to ESP32 S3? Complete our Getting Started with ESP32 S3 guide first.
- Set up the Arduino IDE with ESP32 S3 board support installed.
- Wire the LED bar graph to the ESP32 S3 following the wiring diagram above, inserting a 220Ω resistor between each anode pin and its corresponding GPIO pin, and connecting all cathode pins to GND.
- Connect the ESP32 S3 to your computer using a USB-C cable.
- Open the Arduino IDE.
- Select the correct ESP32 S3 board from Tools > Board and the correct port from Tools > Port.
- Copy the code above and paste it into a new Arduino sketch.
- Click Upload to compile and flash the code to the ESP32 S3.
- Observe the LED bar graph: segments should light up one by one from left to right, hold briefly, then turn off one by one from right to left, repeating continuously.
- Open the Serial Monitor at 115200 baud to see the text representation of the bar animation in real time.
- Pro Tip: Hold the bar graph up to a dark surface to best appreciate the animation effect — the 10 bright red segments produce a vivid visual bar even in daylight.
Serial Monitor Output
Application and Project Ideas
Here are some practical ways to extend this project with real-world use cases.
- Battery level indicator: Show charge state as a 10-step visual bar.
- Volume meter: Visualize audio amplitude from a microphone sensor.
- Signal strength display: Indicate WiFi or cellular signal level.
- Progress bar: Display task completion percentage in an automation project.
- Temperature range indicator: Map temperature values to a visual scale.
- Water level monitor: Show tank fill status with 10 discrete levels.
Challenge Yourself
- Beginner: Connect a potentiometer and map its analog value (0–4095) to the number of lit segments.
- Intermediate: Create a bouncing animation where a single segment moves back and forth.
- Advanced: Read sound level from a microphone module and display real-time amplitude on the bar graph.
Video Tutorial
Watch the step-by-step video walkthrough for this ESP32 S3 project below.