ESP8266 - Serial Plotter
Hardware Preparation
Or you can buy the following kits:
| 1 | × | DIYables Sensor Kit (18 sensors/displays) |
Additionally, some of these links are for products from our own brand, DIYables .
Overview of Serial Plotter
Serial Plotter is a feature of the Arduino IDE. It allows ESP8266 to read temperature, humidity or any other type of sensor data and send it to the Serial Plotter. The Serial Plotter then takes this data and displays it in the form of waveforms. Not only can it display single sensor data, but also multiple sensor data on the same graph.
Data is exchanged between Serial Plotter and ESP8266 through a USB cable. This same cable is used to upload the code to ESP8266. Therefore, in order to use Serial Plotter, it is necessary to connect ESP8266 and PC using this cable.
Serial Plotter has a selection box to choose the serial baud rate and a graph. The X-axis of the graph represents the time, with 500 points. The time between each point is determined by the time between two consecutive Serial.println() function calls, which is usually equal to the time of loop() function. The Y-axis of the graph shows the values received from ESP8266, and it adjusts itself automatically when the value increases or decreases.
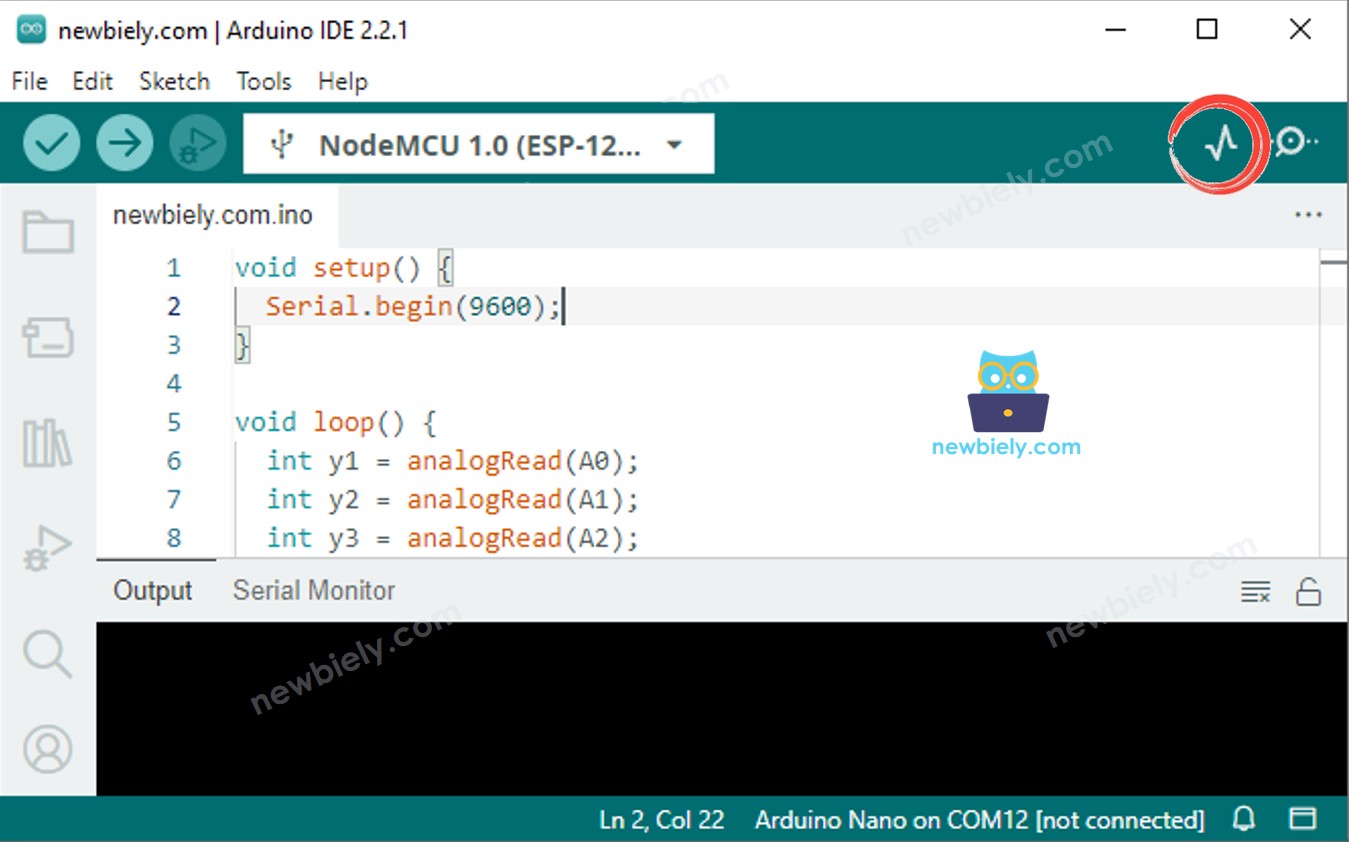
How To Open Serial Plotter
Click the Serial Plotter icon on the right side of Arduino IDE.
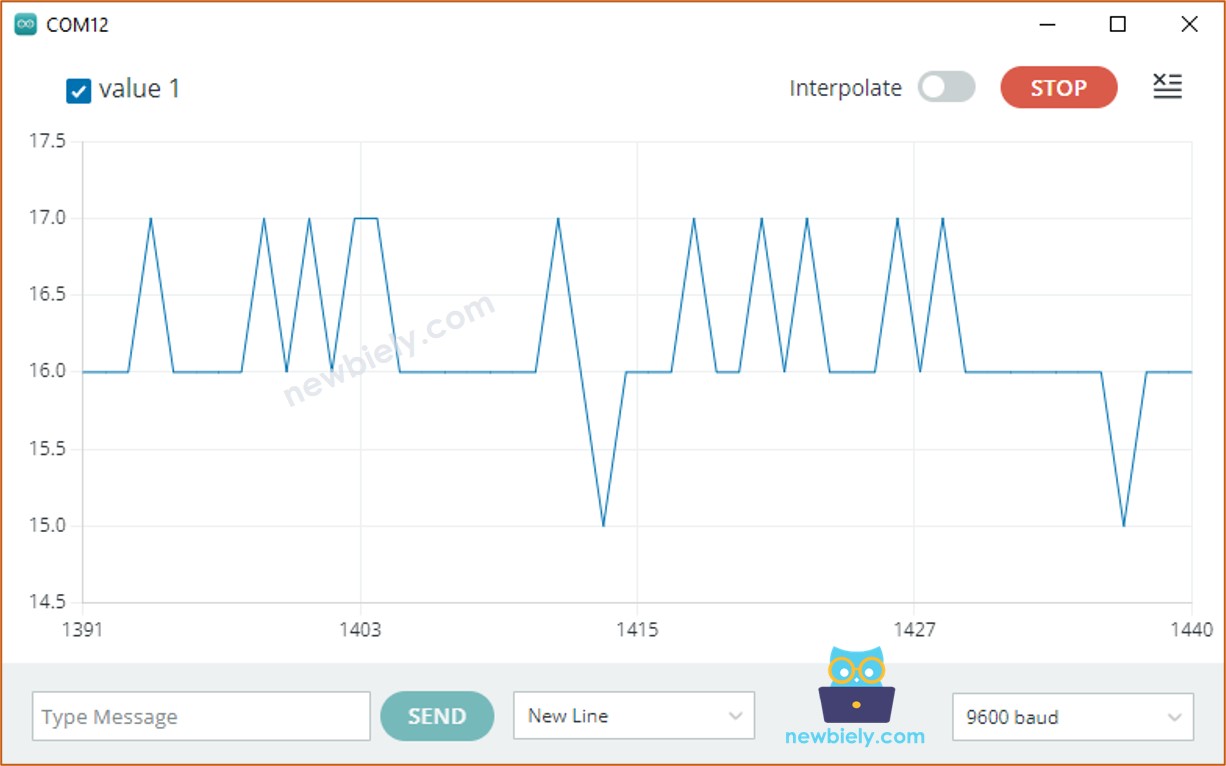
Plotting of Single Line in Graph
To generate a single graph, we just need to send the data and finish it off with the “\r\n” character.
Specifically, we need to use the Serial.println() function.
※ NOTE THAT:
Serial.println() adds “\r\n” characters to the end of data.
Example Code
Take the value from an analog input pin and plot it on Serial Plotter. This is an example of doing so.
Detailed Instructions
To get started with ESP8266 on Arduino IDE, follow these steps:
- Check out the how to setup environment for ESP8266 on Arduino IDE tutorial if this is your first time using ESP8266.
- Wire the components as shown in the diagram.
- Connect the ESP8266 board to your computer using a USB cable.
- Open Arduino IDE on your computer.
- Choose the correct ESP8266 board, such as (e.g. NodeMCU 1.0 (ESP-12E Module)), and its respective COM port.
- Copy the code and open it in the Arduino IDE.
- Click the Upload button in the IDE to send the code to the ESP8266.
- Open the Serial Plotter.
- Set the baud rate to 9600.
- Check out the graph on the Serial Plotter.
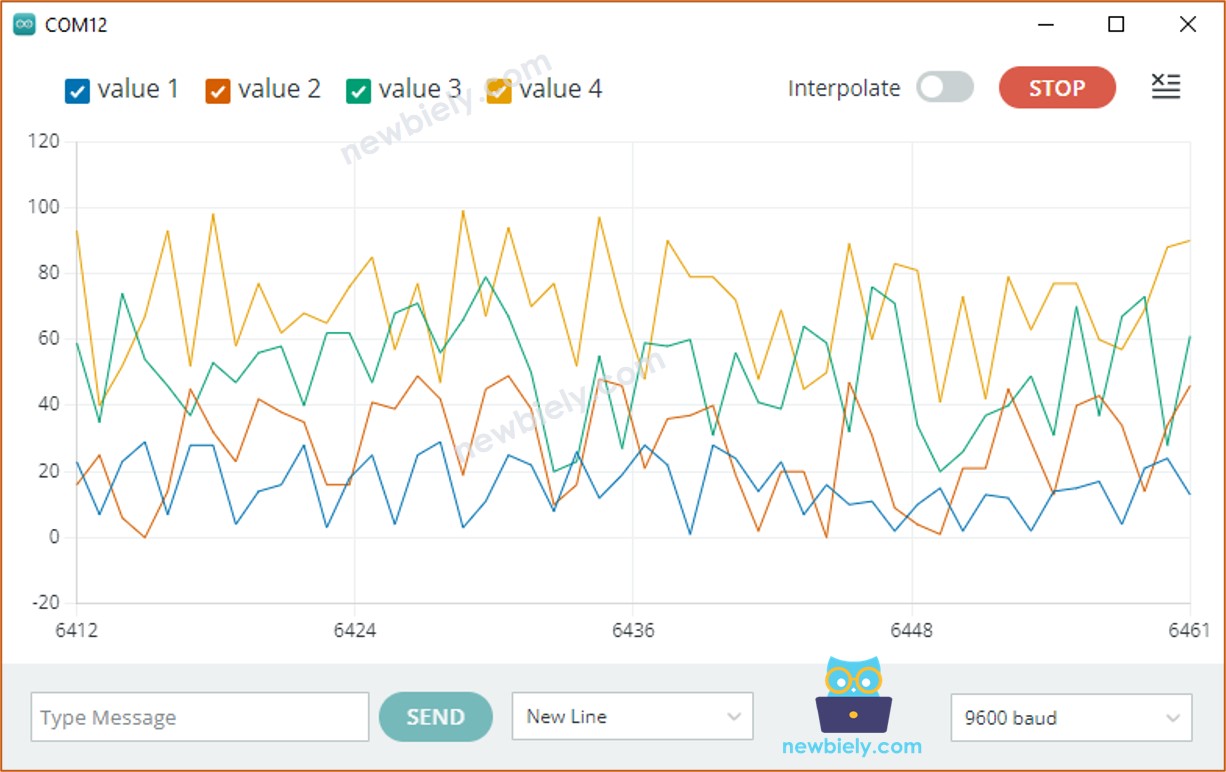
Plotting of Multiple Lines in Graph
In order to plot multiple variables, we must separate them from one another using either the “\t” or " " character. The final value MUST be ended with “\r\n” characters.
- The first variable:
- The variables in the middle:
- The final variable:
Example Code
Take the value from four analog input pins and display them on Serial Plotter.
Using multiple graphs:. Create multiple graphs to illustrate the data.
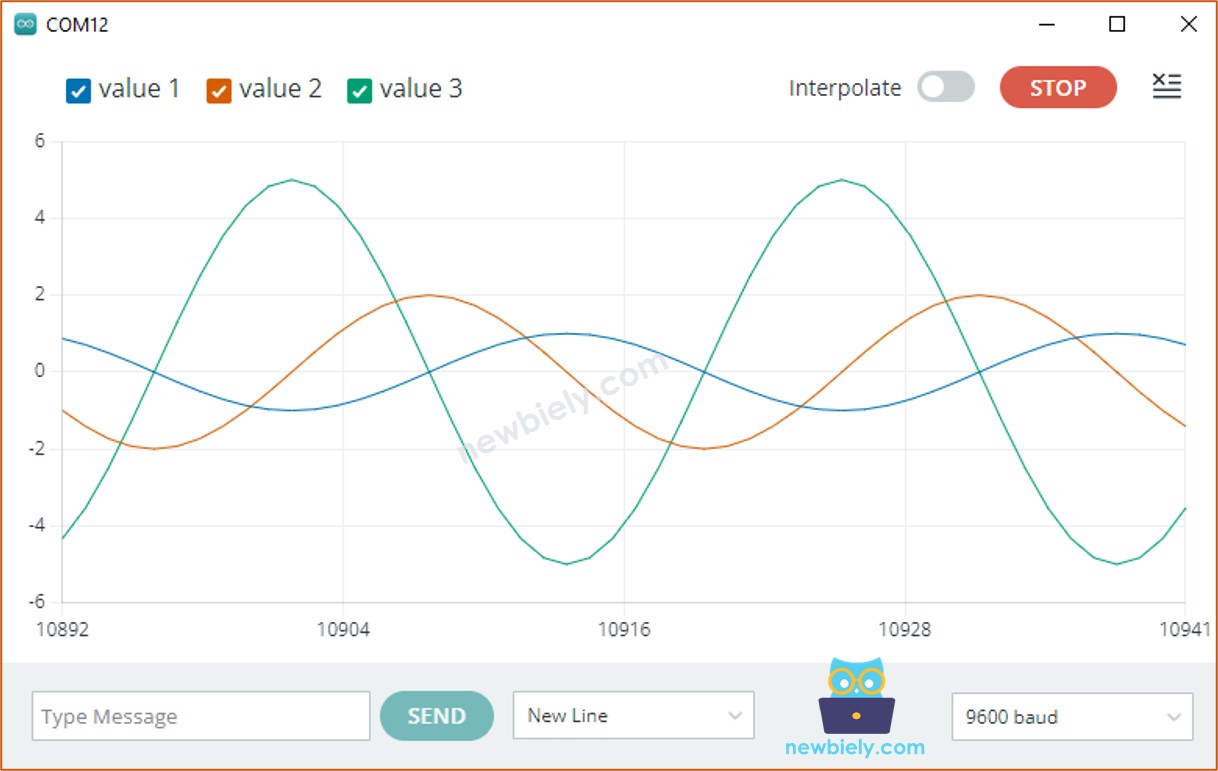
Example of 3 Sine Waveforms
Graph of Multiple Sine Waves:. A representation of multiple sine waves is depicted in the graph.
If you wish to view this plotter on your smartphone or PC, visit the ESP8266 - Web Plotter tutorial.