
ESP32 S3 - Web Plotter
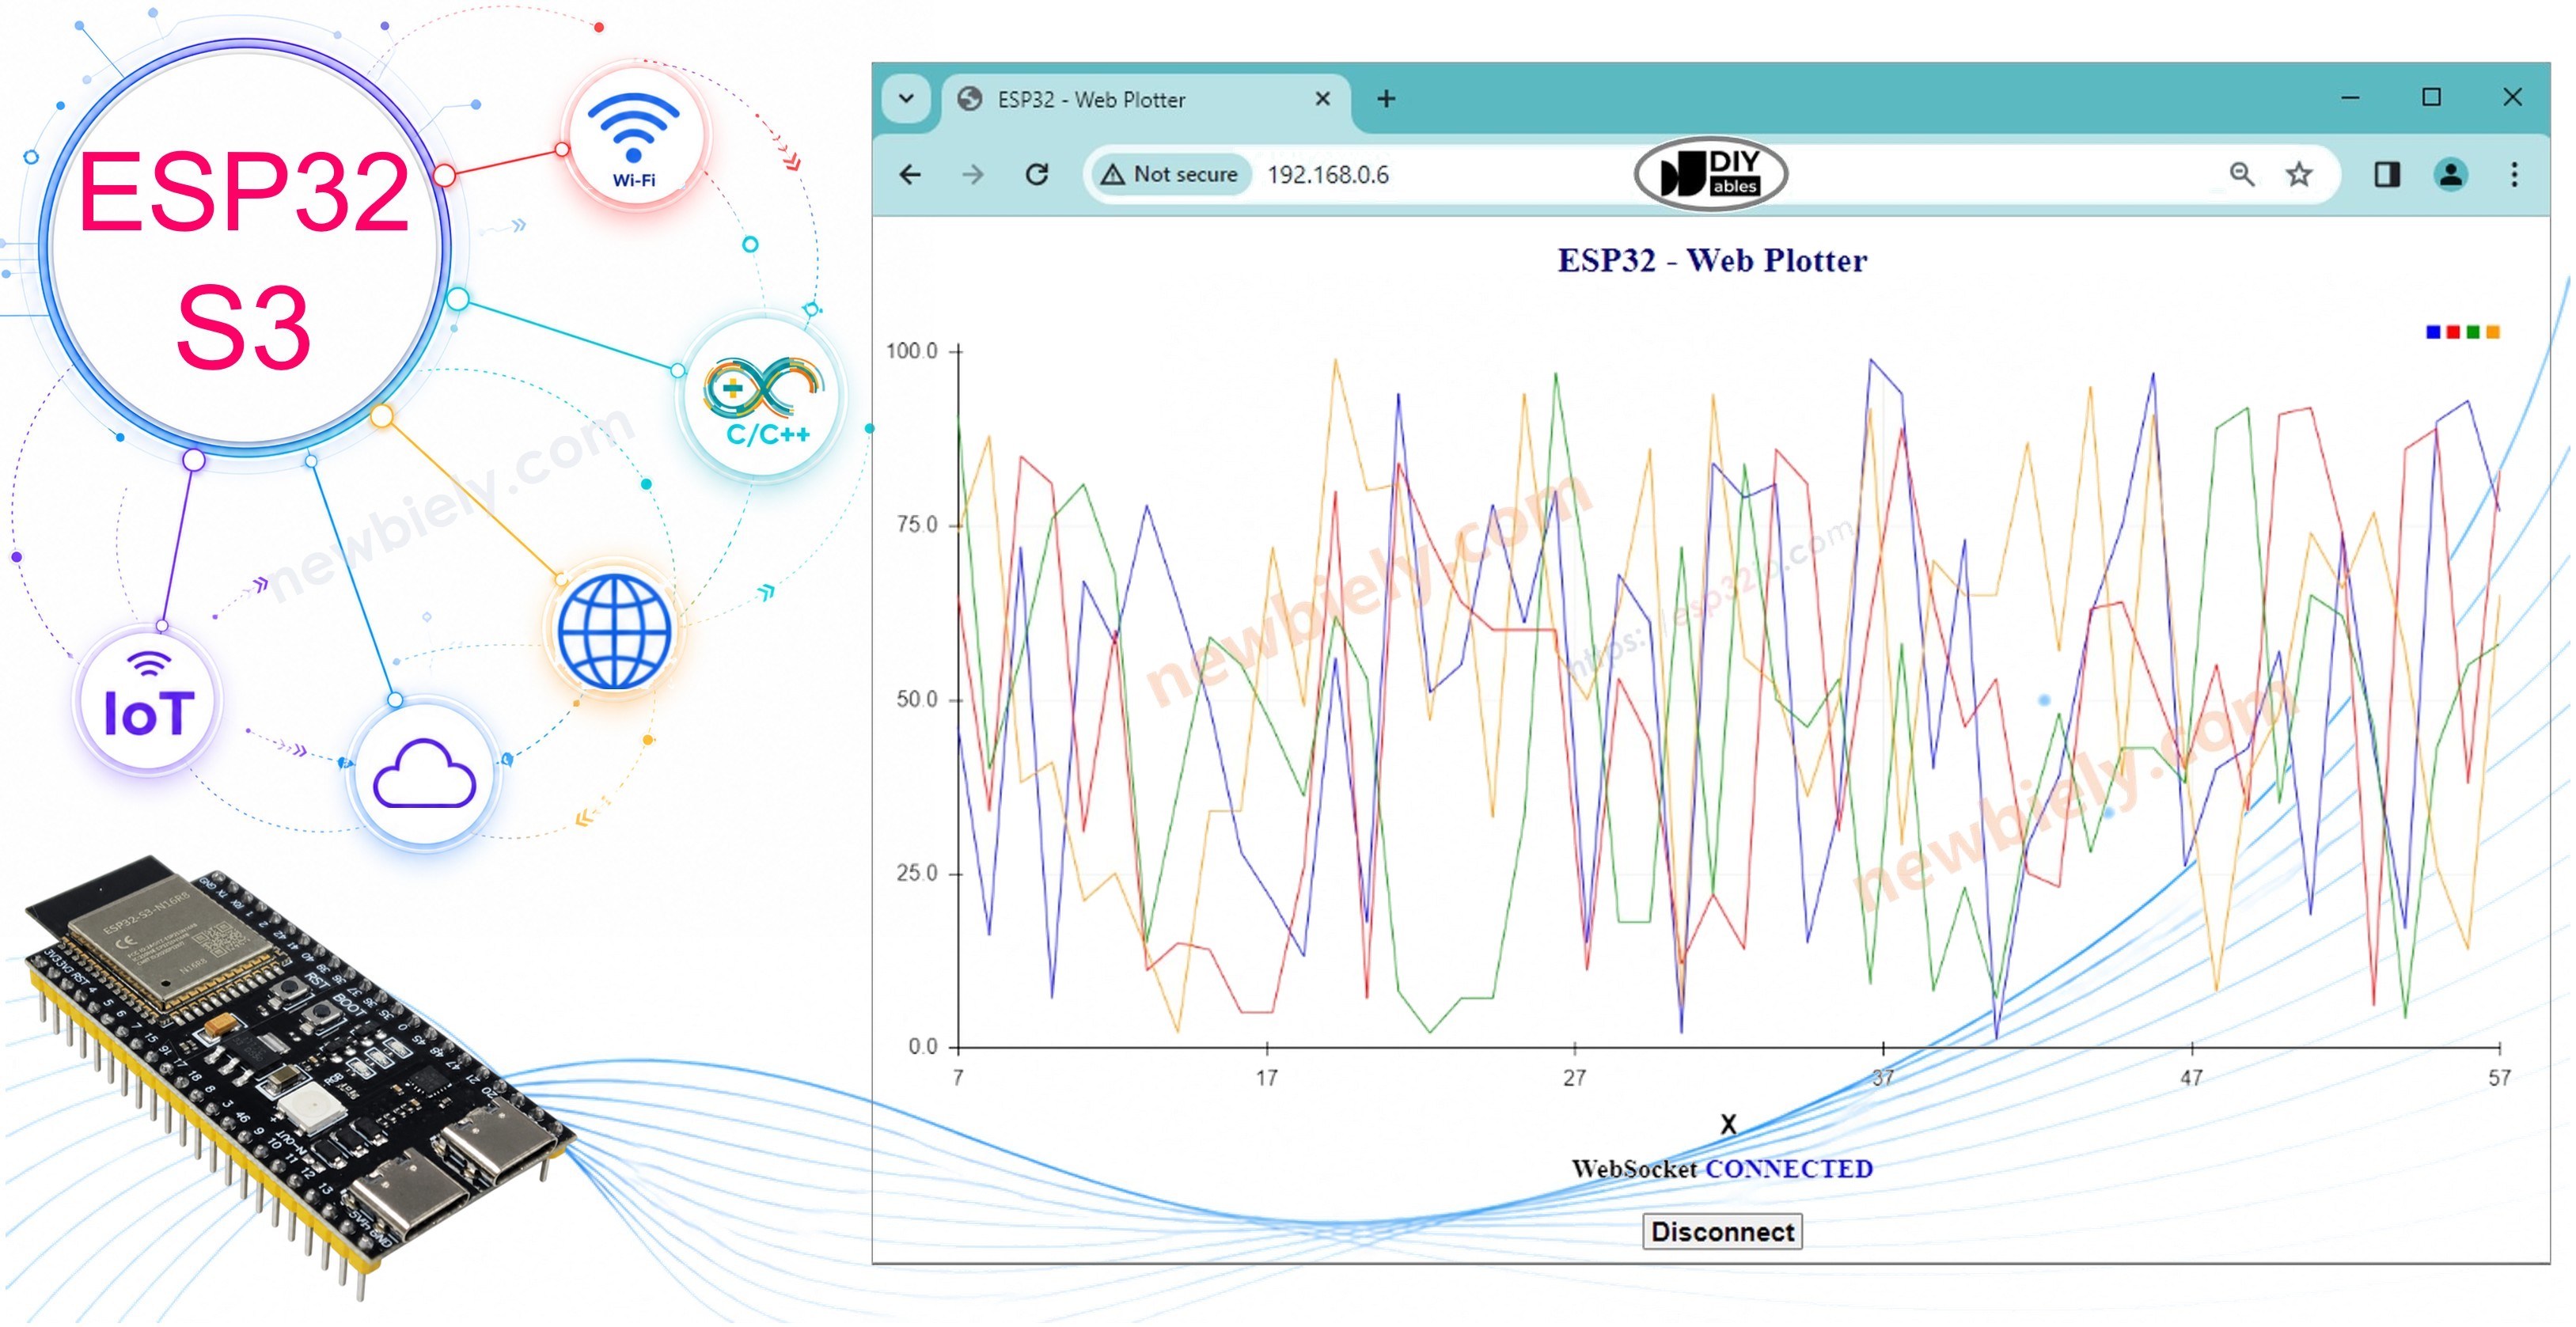
In this tutorial, we will learn how to create a web plotter on the ESP32 S3 that looks similar to the Serial Plotter in Arduino IDE. With this setup, you can easily check real-time data from an ESP32 S3 using a web browser on your smartphone or PC, displaying the data in a live graph just like the Serial Plotter in Arduino IDE.
What you'll build:
- A web server running on the ESP32 S3 that serves an interactive plotter page
- A WebSocket connection between the ESP32 S3 and web browser for real-time data streaming
- A live graph that plots multiple data variables simultaneously in the browser
- A portable monitoring tool accessible from any device on the same Wi-Fi network
Hardware Preparation
Or you can buy the following kits:
| 1 | × | DIYables ESP32 S3 Starter Kit (ESP32 S3 included) | |
| 1 | × | DIYables Sensor Kit (18 sensors/displays) |
Additionally, some of these links are for products from our own brand, DIYables .
How Web Plotter Works
The ESP32 S3 code creates both a web server and a WebSocket server, giving the browser two communication channels to work with. When a user accesses the webpage hosted on the ESP32 S3 via a web browser, the web server returns the full web content — HTML, CSS, and JavaScript — which renders an interactive graph that closely resembles the Serial Plotter in Arduino IDE. Once the user clicks the connect button on the page, the JavaScript code establishes a WebSocket connection to the ESP32 S3, which then streams data continuously so the graph updates in real time.
Key Points
- The ESP32 S3 code creates a web server and WebSocket server.
- When a user accesses the webpage on the ESP32 S3 board via a web browser, the web server returns the web content (HTML, CSS, JavaScript) back to the web browser.
- The JavaScript code draws a graph on the web browser that looks like the Serial Plotter.
- When a user clicks the connect button on the web, the JavaScript code creates a WebSocket connection to the WebSocket server on the ESP32 S3 board.
- The ESP32 S3 sends data via the WebSocket connection to the web browser in a format similar to the Serial Plotter (see the next part).
- The JavaScript code on the web browser receives the data and plots it on the graph.
The data format that ESP32 S3 sends to the web plotter
To plot multiple variables, we need to separate variables from each other by "\t" or " " character. The last value MUST be terminated by "\r\n" characters.
In detail:
- The first variable
- The middle variables
- The last variable
For more detail, please refer to ESP32 S3 - Serial Plotter tutorial
ESP32 S3 Code - Web Plotter
The webpage's content (HTML, CSS, JavaScript) are stored separately in an index.h file, keeping the main sketch clean and focused on the server logic. The following code uses a WebSocket server to stream data from the ESP32 S3 to the browser in real time. So, we will have two code files on Arduino IDE:
- An .ino file that is ESP32 S3 code, which creates a web server and WebSocket server
- An .h file, which contains the webpage's content.
Detailed Instructions
- New to ESP32 S3? Complete our Getting Started with ESP32 S3 guide first.
- Connect the ESP32 S3 board to your PC via a USB Type-C cable.
- Open Arduino IDE on your PC.
- Select the right ESP32 S3 board (e.g. ESP32S3 Dev Module) and COM port.
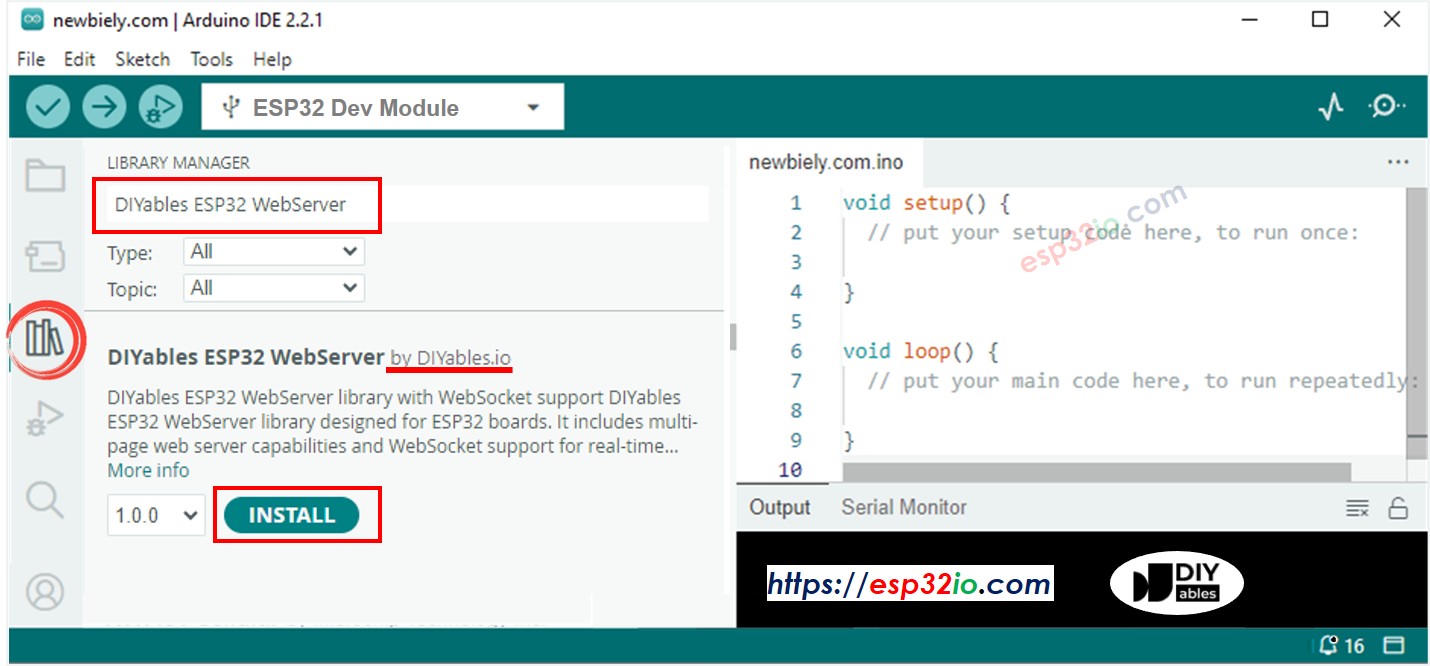
- Open the Library Manager by clicking on the Library Manager icon on the left navigation bar of Arduino IDE.
- Search "DIYables ESP32 WebServer", then find the Web Server library created by DIYables.
- Click Install button to install the Web Server library.
- On Arduino IDE, create a new sketch. Give it a name, for example, newbiely.com.ino.
- Copy the below code and open with Arduino IDE.
- Modify the WiFi information (SSID and password) in the code to match your own network credentials.
- Create the index.h file on Arduino IDE by:
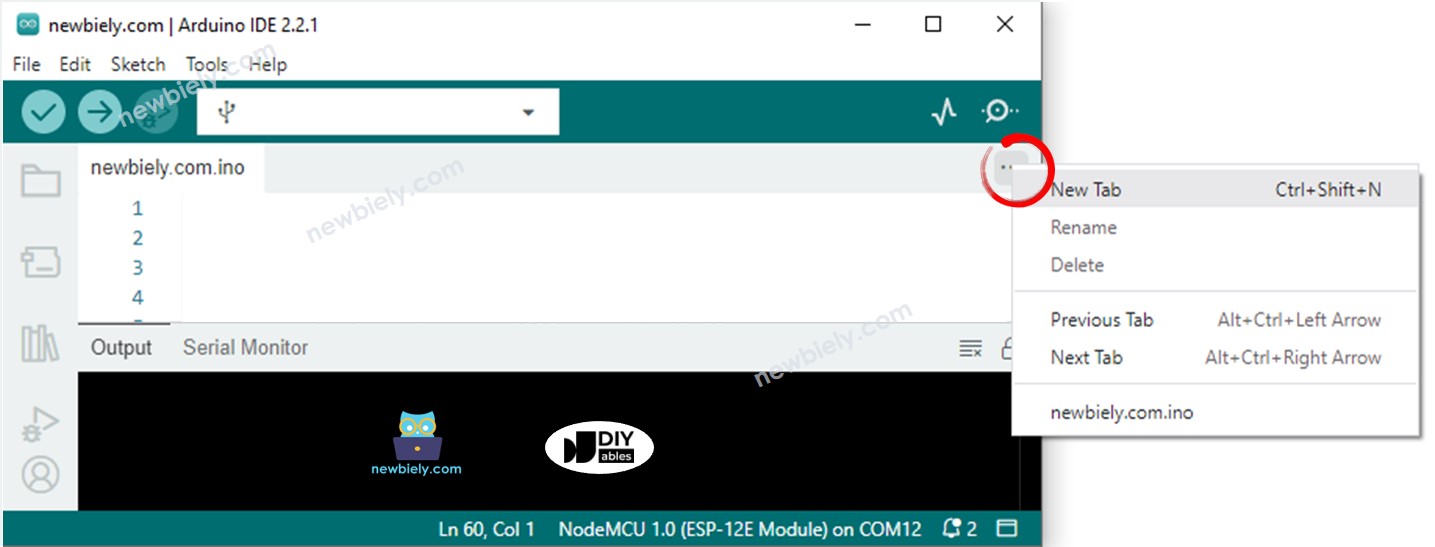
- Either click on the button just below the serial monitor icon and choose New Tab, or use Ctrl+Shift+N keys.
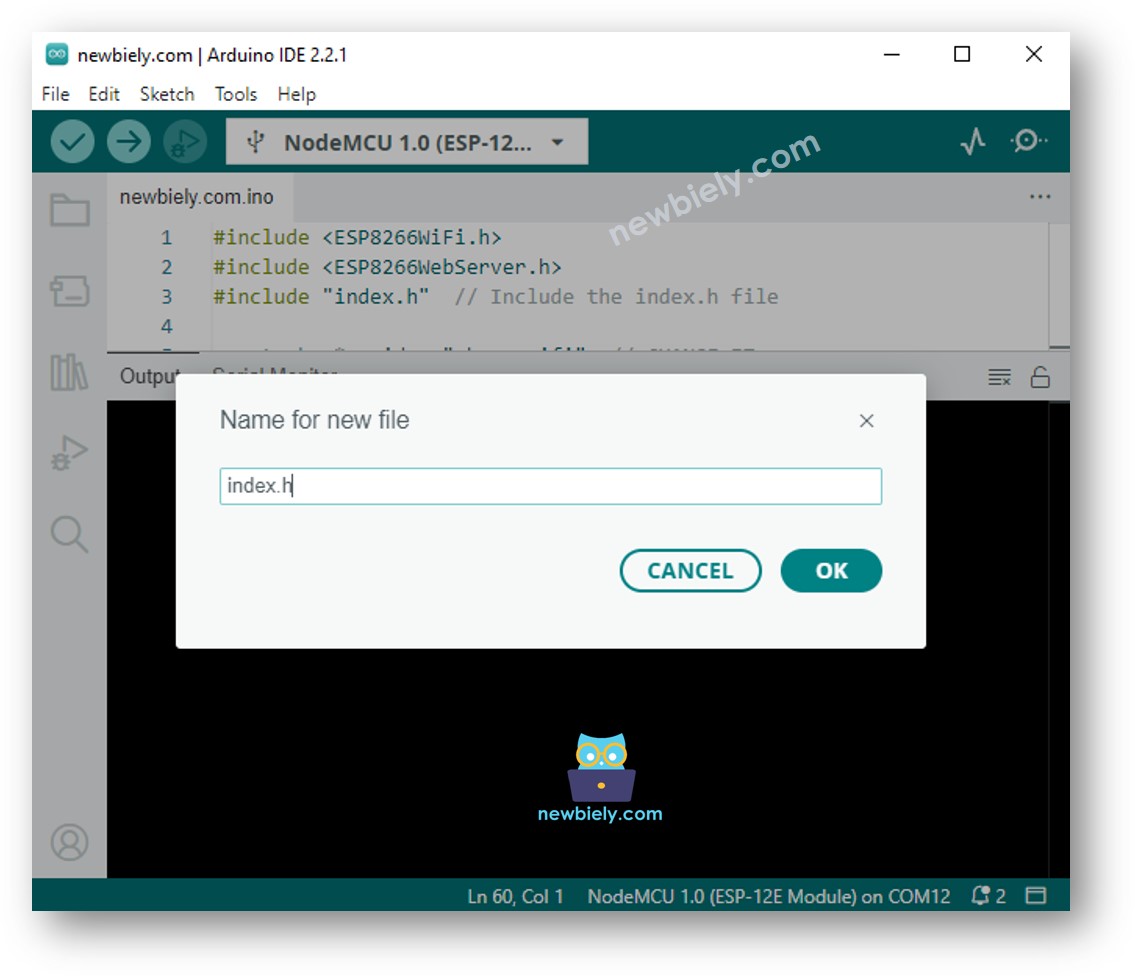
- Give the file's name index.h and click OK button.
- Copy the below code and paste it to the index.h.
- Now you have the code in two files: newbiely.com.ino and index.h.
- Click Upload button on Arduino IDE to upload code to the ESP32 S3.
- Open the Serial Monitor.
- Check out the result on Serial Monitor.
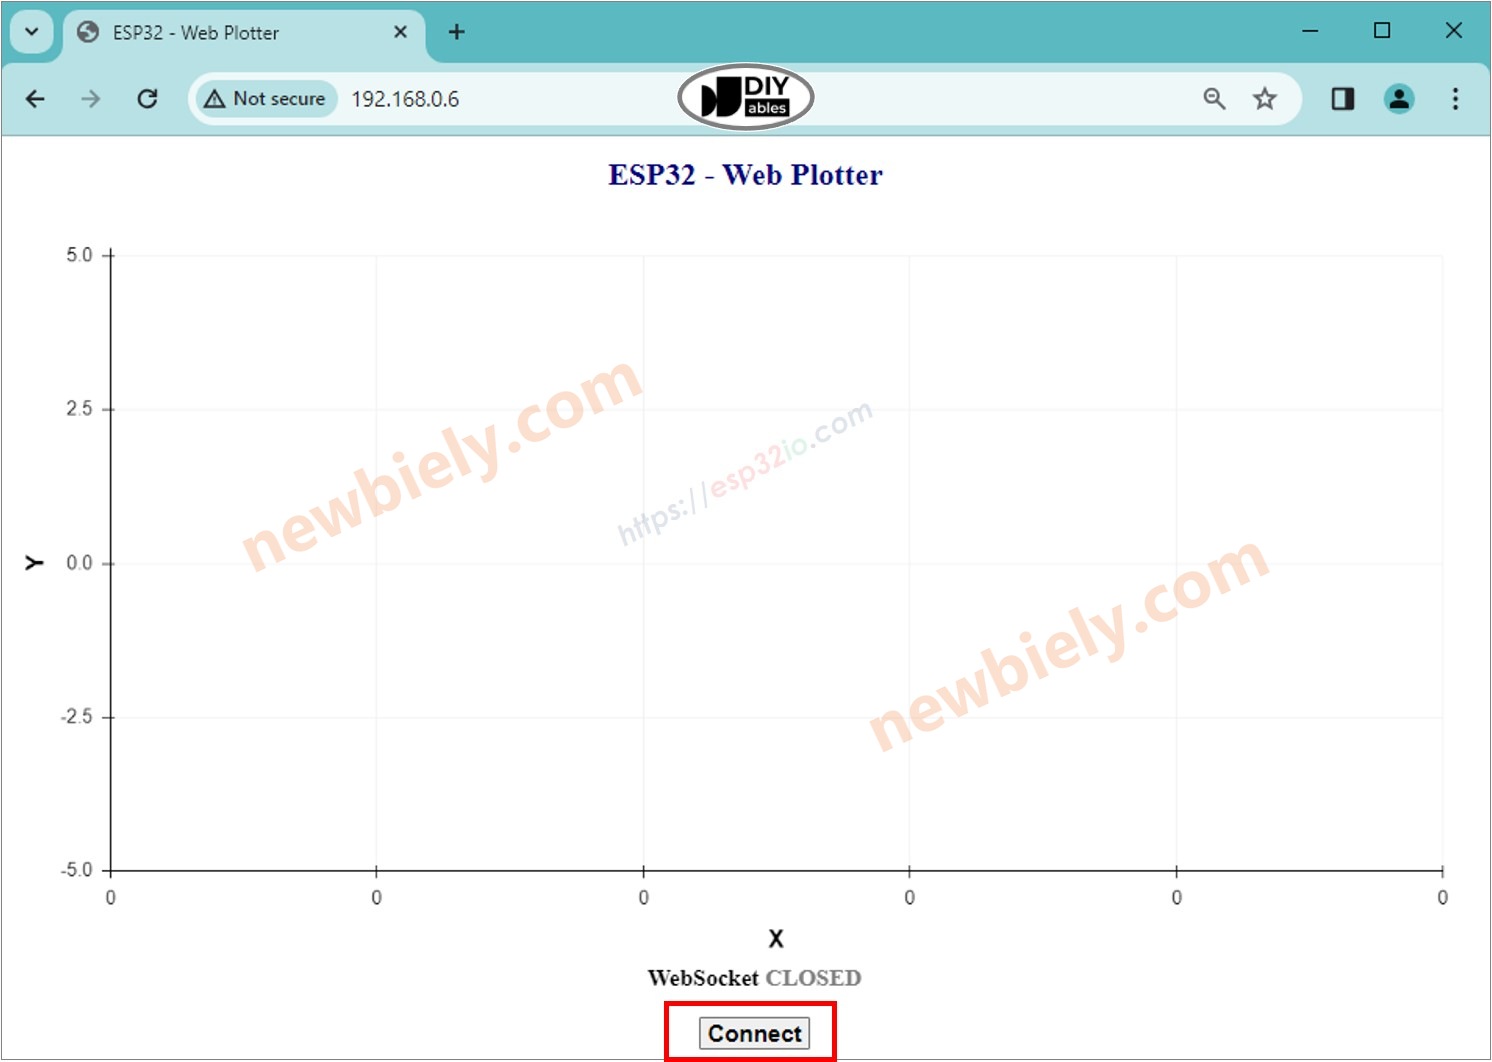
- Take note of the IP address displayed, and enter this address into the address bar of a web browser on your smartphone or PC.
- You will see the webpage as below:
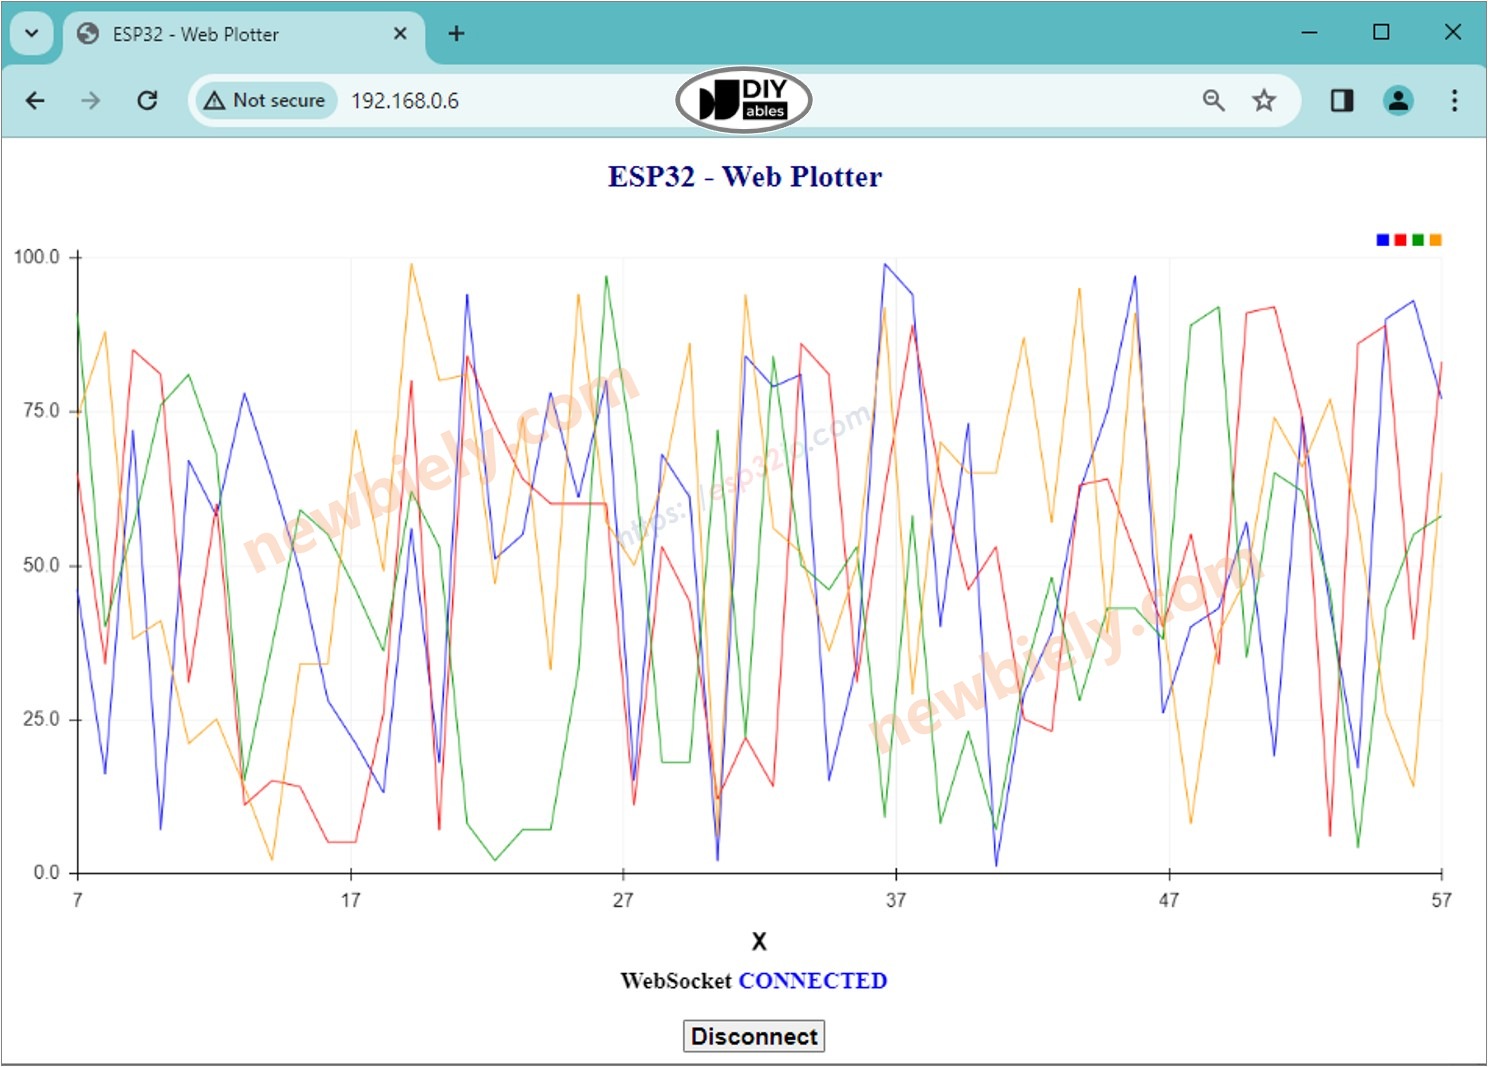
- Click the CONNECT button to connect the webpage to the ESP32 S3 via WebSocket.
- You will see the plotter plots data as the below image.
- You can open the Serial Plotter on Arduino IDE to compare with the Web Plotter on the web browser.
- If you modify the HTML content in the index.h and do not touch anything in the newbiely.com.ino file, when you compile and upload code to the ESP32 S3, Arduino IDE will not update the HTML content.
- To make Arduino IDE update the HTML content in this case, make a change in the newbiely.com.ino file (e.g. adding an empty line or a comment).
- Pro Tip: Bookmark the ESP32 S3's IP address in your browser for quick access to the web plotter whenever your device is connected to the same Wi-Fi network.
※ NOTE THAT:
Line-by-line Code Explanation
The above ESP32 S3 code contains line-by-line explanation. Please read the comments in the code!
Applications
The ESP32 S3 web plotter is a powerful tool for any project that requires real-time data visualization without a dedicated display. Here are some practical use cases:
- Sensor Monitoring: Plot temperature, humidity, or pressure readings over time to spot trends and anomalies.
- Motor Control Feedback: Visualize PID controller output, motor speed, and setpoint simultaneously for tuning.
- Battery Voltage Tracker: Monitor battery charge and discharge curves during testing and development.
- Environmental Logger: Display multiple environmental sensors — CO2, particulate matter, light — on a single graph.
- Signal Analysis: Plot analog input waveforms to debug sensor noise or signal conditioning circuits.
Video Tutorial
Watch the step-by-step video walkthrough for this ESP32 S3 project below.
Challenges
Now that your ESP32 S3 web plotter is working, try extending it with these progressively more complex challenges.
- Beginner: Add a second data variable (e.g., a potentiometer reading) and plot it alongside the first on the same graph.
- Intermediate: Add labels for each plotted line by modifying the index.h HTML/JavaScript to display a color-coded legend.
- Advanced: Implement a data logging feature that saves the plotted values to a CSV file on an SD card connected to the ESP32 S3.